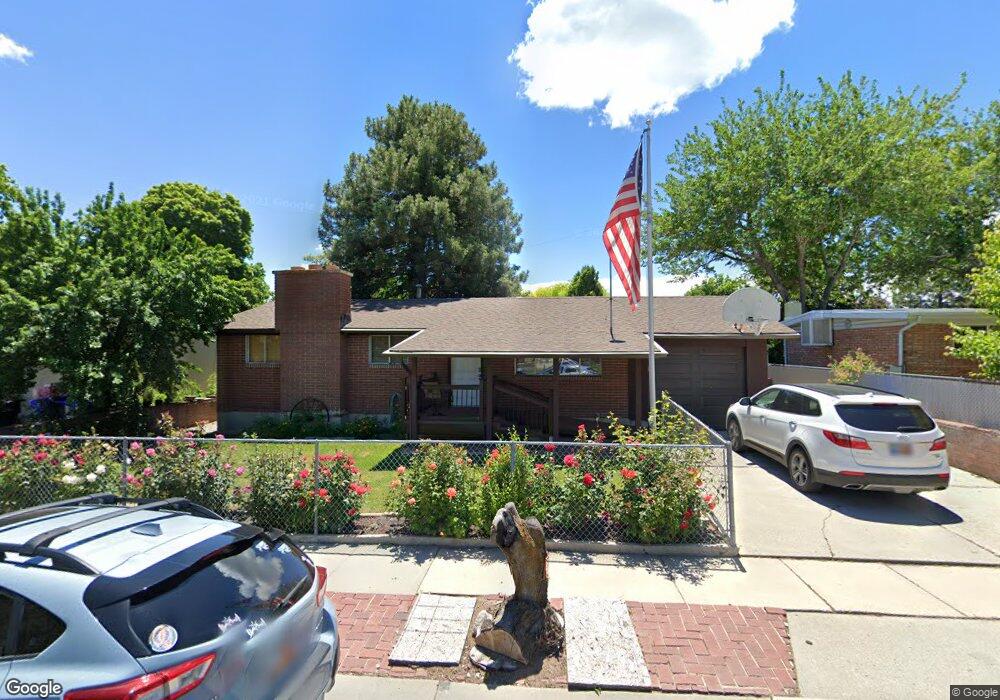
2899 W 7550 S West Jordan, UT 84084
Estimated Value: $463,000 - $495,307
5
Beds
1
Bath
1,025
Sq Ft
$467/Sq Ft
Est. Value
About This Home
This home is located at 2899 W 7550 S, West Jordan, UT 84084 and is currently estimated at $478,577, approximately $466 per square foot. 2899 W 7550 S is a home located in Salt Lake County with nearby schools including Westland Elementary School, Joel P. Jensen Middle School, and West Jordan High School.
Ownership History
Date
Name
Owned For
Owner Type
Purchase Details
Closed on
Sep 26, 2002
Sold by
Halls Nord and Halls Sally Laree
Bought by
Halls Nord and Halls Sally Laree
Current Estimated Value
Home Financials for this Owner
Home Financials are based on the most recent Mortgage that was taken out on this home.
Original Mortgage
$50,000
Outstanding Balance
$20,793
Interest Rate
6.05%
Mortgage Type
Credit Line Revolving
Estimated Equity
$457,784
Purchase Details
Closed on
Jun 13, 2001
Sold by
Halls Nord and Halls Sally Laree
Bought by
Halls Nord and Halls Sally Laree
Home Financials for this Owner
Home Financials are based on the most recent Mortgage that was taken out on this home.
Original Mortgage
$11,000
Interest Rate
7.15%
Mortgage Type
Credit Line Revolving
Purchase Details
Closed on
Dec 16, 1997
Sold by
Reeves Farm Inc
Bought by
Key Stone Land Development L C
Purchase Details
Closed on
Dec 15, 1997
Sold by
West Jordan City
Bought by
Key Stone Land Development L C
Purchase Details
Closed on
Apr 9, 1997
Sold by
Lehmitz Mary C and Malmstrom Mildred L
Bought by
Keystone Land Development L C and Reeves Farm Inc
Home Financials for this Owner
Home Financials are based on the most recent Mortgage that was taken out on this home.
Original Mortgage
$2,225,000
Interest Rate
7.66%
Create a Home Valuation Report for This Property
The Home Valuation Report is an in-depth analysis detailing your home's value as well as a comparison with similar homes in the area
Home Values in the Area
Average Home Value in this Area
Purchase History
| Date | Buyer | Sale Price | Title Company |
|---|---|---|---|
| Halls Nord | -- | -- | |
| Halls Nord | -- | Backman Stewart Title Servic | |
| Halls Nord | -- | Backman Stewart Title Servic | |
| Halls Nord | -- | Backman Stewart Title Servic | |
| Key Stone Land Development L C | -- | -- | |
| Key Stone Land Development L C | -- | -- | |
| Keystone Land Development L C | -- | -- |
Source: Public Records
Mortgage History
| Date | Status | Borrower | Loan Amount |
|---|---|---|---|
| Open | Halls Nord | $50,000 | |
| Closed | Halls Nord | $11,000 | |
| Previous Owner | Keystone Land Development L C | $2,225,000 |
Source: Public Records
Tax History Compared to Growth
Tax History
| Year | Tax Paid | Tax Assessment Tax Assessment Total Assessment is a certain percentage of the fair market value that is determined by local assessors to be the total taxable value of land and additions on the property. | Land | Improvement |
|---|---|---|---|---|
| 2025 | $2,064 | $446,000 | $123,700 | $322,300 |
| 2024 | $2,064 | $397,100 | $113,900 | $283,200 |
| 2023 | $2,065 | $374,400 | $109,500 | $264,900 |
| 2022 | $2,154 | $384,200 | $107,400 | $276,800 |
| 2021 | $2,366 | $306,300 | $82,500 | $223,800 |
| 2020 | $1,772 | $270,000 | $71,300 | $198,700 |
| 2019 | $1,675 | $250,300 | $71,300 | $179,000 |
| 2018 | $0 | $225,900 | $68,200 | $157,700 |
| 2017 | $1,412 | $208,400 | $68,200 | $140,200 |
| 2016 | $1,295 | $179,500 | $68,200 | $111,300 |
| 2015 | $1,307 | $176,700 | $72,700 | $104,000 |
| 2014 | -- | $155,900 | $64,900 | $91,000 |
Source: Public Records
Map
Nearby Homes
- 2886 W 7550 S
- 7604 S Autumn Dr
- 7721 Sunset Cir
- 3165 W 7720 S
- 7642 S 2700 W
- 3066 W Linton Dr
- 7611 S Springbrook Dr
- 3354 W 7800 S
- 7942 S 2800 W
- 7987 S 2980 W
- 7361 S 2700 W
- 2573 Jordan Meadows Ln
- 3422 Briar Dr
- 7647 S 2500 W
- 7993 S 2760 W
- 2510 W Jordan Meadows Ln
- 7968 S 2700 W
- 2386 W 7680 S
- 3476 W Spaulding Rd
- 3332 Lower Newark Way