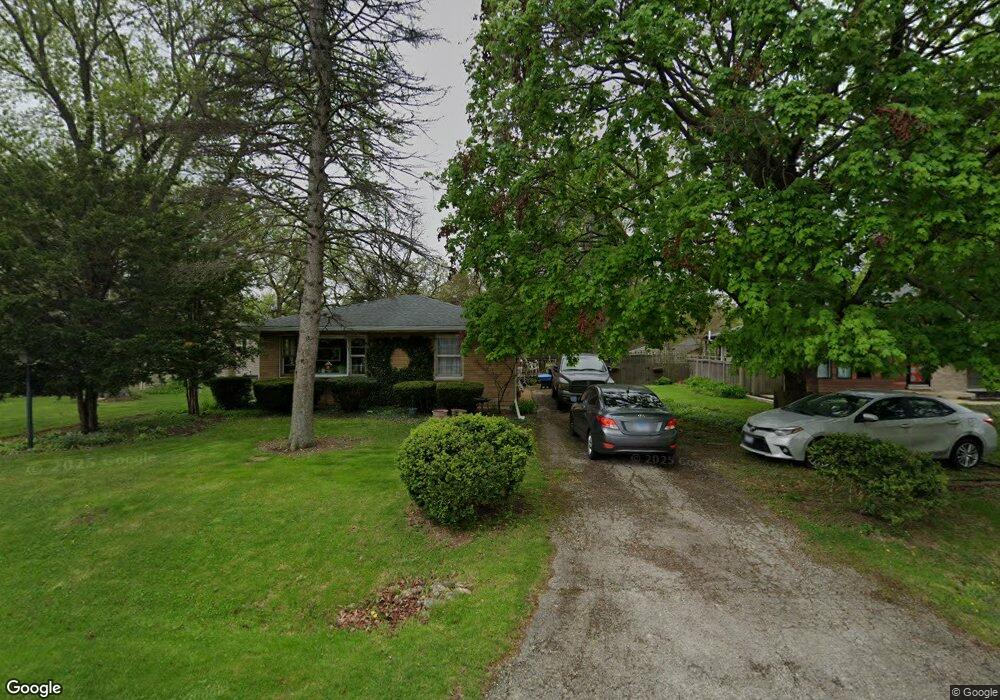
28W721 Barnes Ave West Chicago, IL 60185
Chicago West NeighborhoodEstimated Value: $297,966 - $351,000
--
Bed
--
Bath
1,228
Sq Ft
$273/Sq Ft
Est. Value
About This Home
This home is located at 28W721 Barnes Ave, West Chicago, IL 60185 and is currently estimated at $335,492, approximately $273 per square foot. 28W721 Barnes Ave is a home located in DuPage County with nearby schools including Indian Knoll Elementary School, Leman Middle School, and West Chicago Community High School.
Ownership History
Date
Name
Owned For
Owner Type
Purchase Details
Closed on
Mar 20, 2003
Sold by
Elfstrom Cheryl L
Bought by
Elfstrom David S
Current Estimated Value
Purchase Details
Closed on
Oct 31, 1999
Sold by
Elfstrom David S
Bought by
Elfstrom David S and Elfstrom Cheryl L
Purchase Details
Closed on
Dec 18, 1994
Sold by
Elfstrom Donald H and Elfstrom Marjorie A
Bought by
Elfstrom David S
Home Financials for this Owner
Home Financials are based on the most recent Mortgage that was taken out on this home.
Original Mortgage
$83,600
Interest Rate
9.06%
Mortgage Type
Purchase Money Mortgage
Purchase Details
Closed on
Dec 12, 1994
Sold by
Adrian Frank J and Adrian Lori A
Bought by
Elfstrom David S and Elfstrom Donald H
Home Financials for this Owner
Home Financials are based on the most recent Mortgage that was taken out on this home.
Original Mortgage
$83,600
Interest Rate
9.06%
Mortgage Type
Purchase Money Mortgage
Create a Home Valuation Report for This Property
The Home Valuation Report is an in-depth analysis detailing your home's value as well as a comparison with similar homes in the area
Home Values in the Area
Average Home Value in this Area
Purchase History
| Date | Buyer | Sale Price | Title Company |
|---|---|---|---|
| Elfstrom David S | -- | -- | |
| Elfstrom David S | -- | -- | |
| Elfstrom David S | -- | -- | |
| Elfstrom David S | $104,500 | Attorneys Title Guaranty Fun |
Source: Public Records
Mortgage History
| Date | Status | Borrower | Loan Amount |
|---|---|---|---|
| Closed | Elfstrom David S | $83,600 |
Source: Public Records
Tax History Compared to Growth
Tax History
| Year | Tax Paid | Tax Assessment Tax Assessment Total Assessment is a certain percentage of the fair market value that is determined by local assessors to be the total taxable value of land and additions on the property. | Land | Improvement |
|---|---|---|---|---|
| 2024 | $6,235 | $84,789 | $26,748 | $58,041 |
| 2023 | $5,880 | $77,440 | $24,430 | $53,010 |
| 2022 | $5,711 | $72,370 | $22,830 | $49,540 |
| 2021 | $5,379 | $69,370 | $21,880 | $47,490 |
| 2020 | $5,276 | $67,270 | $21,220 | $46,050 |
| 2019 | $5,122 | $64,060 | $20,210 | $43,850 |
| 2018 | $5,009 | $61,610 | $19,440 | $42,170 |
| 2017 | $4,878 | $58,540 | $18,470 | $40,070 |
| 2016 | $4,739 | $54,580 | $17,220 | $37,360 |
| 2015 | $4,623 | $50,520 | $15,940 | $34,580 |
| 2014 | $4,653 | $50,520 | $15,940 | $34,580 |
| 2013 | $4,727 | $52,360 | $16,520 | $35,840 |
Source: Public Records
Map
Nearby Homes
- 28W659 Lester St
- 29W034 Lester St
- N268 Calvin Ave
- 34 S Lake Dr
- 0N230 Easton Ave
- 821 Bishop St
- 1350 Sarana Ave
- 28W068 Shelburne Farms Dr
- 0N094 Vermont Ct
- 0N062 Forsythe Ct
- 0N081 Forsythe Ct
- 27W773 Beecher Ave
- 0N082 Forsythe Ct
- 550 Main St Unit 215
- S639 Prince Crossing Rd
- 264 Augusta Ave
- 213 Glen St
- 0N069 Windermere Rd Unit 2301
- 0N200 Windermere Rd Unit 2702
- 143 Conde St
- 28W735 Barnes Ave
- 28W719 Barnes Ave
- 28W745 Barnes Ave
- 28W718 Barnes Ave
- 28W724 Forest Ave
- 28W730 Barnes Ave
- 28W710 Barnes Ave
- 28W728 Forest Ave
- 28W738 Barnes Ave
- 28W702 Forest Ave
- 28W750 Forest Ave
- 28W750 Forest Ave
- 28W750 Forest Ave
- 28W750 Forest Ave
- 28W692 Forest Ave
- 28W748 Barnes Ave
- 28W700 Barnes Ave
- 28W755 Barnes Ave
- 28 Barnes Ave
- 28W758 Barnes Ave