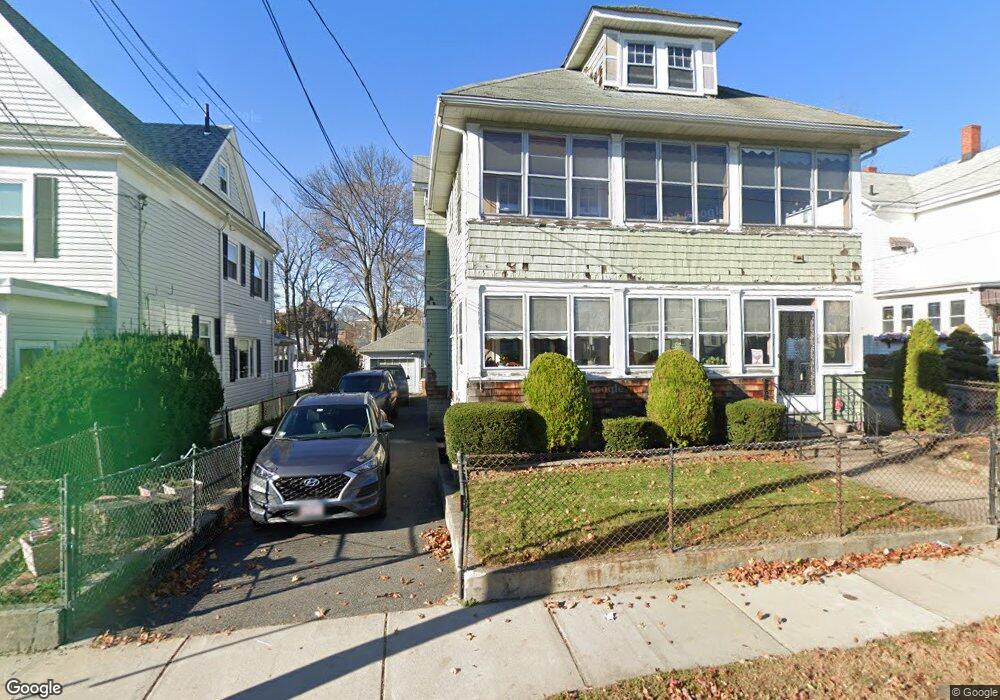
29-31 Church St Malden, MA 02148
Maplewood NeighborhoodEstimated Value: $852,206 - $1,254,000
6
Beds
2
Baths
2,632
Sq Ft
$390/Sq Ft
Est. Value
About This Home
This home is located at 29-31 Church St, Malden, MA 02148 and is currently estimated at $1,027,552, approximately $390 per square foot. 29-31 Church St is a home located in Middlesex County with nearby schools including Malden High School and Malden Catholic.
Ownership History
Date
Name
Owned For
Owner Type
Purchase Details
Closed on
Jan 15, 2008
Sold by
Arno Joseph V
Bought by
Joseph V Arno Nt and Arno Joseph V
Current Estimated Value
Purchase Details
Closed on
Nov 2, 1998
Sold by
Tabacco Concetta
Bought by
Dellisola John G
Create a Home Valuation Report for This Property
The Home Valuation Report is an in-depth analysis detailing your home's value as well as a comparison with similar homes in the area
Home Values in the Area
Average Home Value in this Area
Purchase History
| Date | Buyer | Sale Price | Title Company |
|---|---|---|---|
| Joseph V Arno Nt | -- | -- | |
| Dellisola John G | $260,000 | -- |
Source: Public Records
Mortgage History
| Date | Status | Borrower | Loan Amount |
|---|---|---|---|
| Open | Dellisola John G | $13,000 | |
| Closed | Dellisola John G | $12,000 | |
| Previous Owner | Dellisola John G | $37,000 | |
| Previous Owner | Dellisola John G | $75,000 |
Source: Public Records
Tax History Compared to Growth
Tax History
| Year | Tax Paid | Tax Assessment Tax Assessment Total Assessment is a certain percentage of the fair market value that is determined by local assessors to be the total taxable value of land and additions on the property. | Land | Improvement |
|---|---|---|---|---|
| 2025 | $87 | $772,600 | $308,500 | $464,100 |
| 2024 | $8,497 | $726,900 | $291,800 | $435,100 |
| 2023 | $8,223 | $674,600 | $266,800 | $407,800 |
| 2022 | $7,861 | $636,500 | $241,800 | $394,700 |
| 2021 | $7,566 | $615,600 | $220,900 | $394,700 |
| 2020 | $7,309 | $577,800 | $210,100 | $367,700 |
| 2019 | $7,186 | $541,500 | $200,100 | $341,400 |
| 2018 | $6,924 | $491,400 | $168,800 | $322,600 |
| 2017 | $6,644 | $468,900 | $168,800 | $300,100 |
| 2016 | $6,244 | $411,900 | $160,500 | $251,400 |
| 2015 | $6,040 | $384,000 | $151,300 | $232,700 |
| 2014 | $5,688 | $353,300 | $137,600 | $215,700 |
Source: Public Records
Map
Nearby Homes
- 35 Church St
- 29 Church St Unit 31
- 23 Church St
- 39 Church St
- 23 Church St Unit 25
- 27 Church St
- 27 Church St Unit B
- 34 Church St
- 30 Church St
- 19 Church St
- 19 Church St Unit 1
- 24 Church St
- 180 Webster St
- 184 Webster St
- 44 Church St Unit 46
- 20 Church St
- 38 Church St
- 13 Church St
- 176 Webster St
- 16 Church St Unit 18