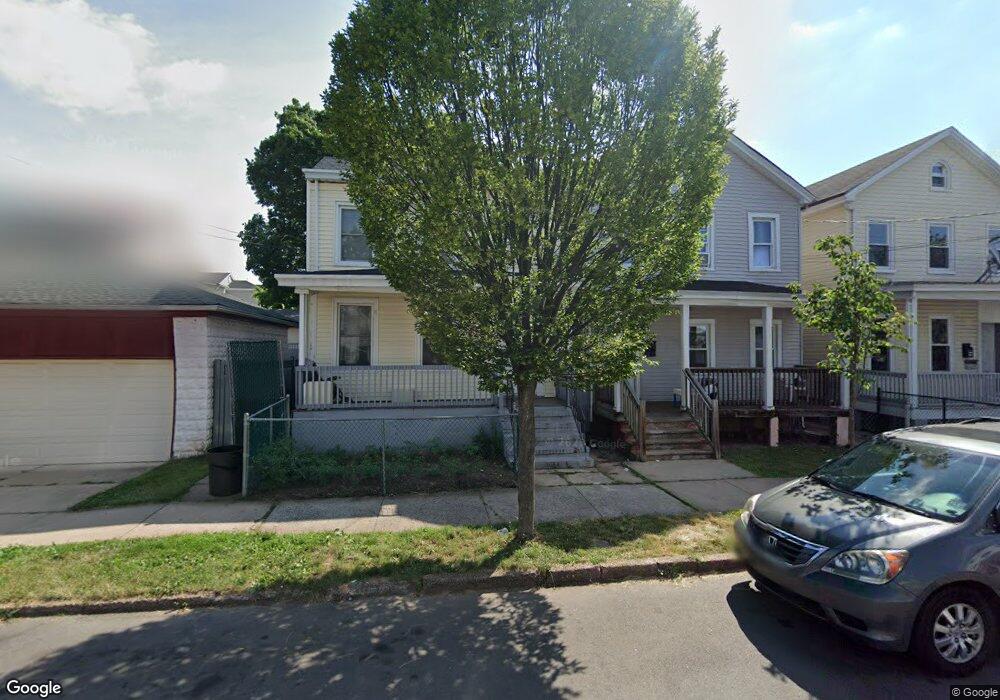
29 Alexander St New Brunswick, NJ 08901
Estimated Value: $332,000 - $406,000
3
Beds
1
Bath
1,200
Sq Ft
$313/Sq Ft
Est. Value
About This Home
This home is located at 29 Alexander St, New Brunswick, NJ 08901 and is currently estimated at $375,519, approximately $312 per square foot. 29 Alexander St is a home located in Middlesex County with nearby schools including New Brunswick High School and Central Jersey College Prep Charter School.
Ownership History
Date
Name
Owned For
Owner Type
Purchase Details
Closed on
Mar 14, 2019
Sold by
Dxy Fund Llc
Bought by
Tby Fund Llc
Current Estimated Value
Purchase Details
Closed on
Sep 18, 2015
Sold by
Cp Srmof Ii 2012 A Trust
Bought by
Dxy Fund Llc
Purchase Details
Closed on
Jun 24, 2015
Sold by
Luengas Ernesto Santiago and Luengas Elizabeth
Bought by
Cp Srmof Ii 2012 A Trust
Purchase Details
Closed on
Aug 29, 2007
Sold by
Rivera Teresa and Gonzalez Roberto
Bought by
Luengas Ernesto Santiago
Home Financials for this Owner
Home Financials are based on the most recent Mortgage that was taken out on this home.
Original Mortgage
$265,800
Interest Rate
6.74%
Mortgage Type
New Conventional
Purchase Details
Closed on
Nov 5, 1999
Sold by
Dolphin Arnita
Bought by
Rivera Teresa and Gozalez Roberto
Home Financials for this Owner
Home Financials are based on the most recent Mortgage that was taken out on this home.
Original Mortgage
$63,900
Interest Rate
7.81%
Create a Home Valuation Report for This Property
The Home Valuation Report is an in-depth analysis detailing your home's value as well as a comparison with similar homes in the area
Home Values in the Area
Average Home Value in this Area
Purchase History
| Date | Buyer | Sale Price | Title Company |
|---|---|---|---|
| Tby Fund Llc | -- | None Available | |
| Dxy Fund Llc | $117,018 | Empire Title | |
| Cp Srmof Ii 2012 A Trust | $412,802 | None Available | |
| Luengas Ernesto Santiago | $270,000 | -- | |
| Rivera Teresa | $71,000 | -- |
Source: Public Records
Mortgage History
| Date | Status | Borrower | Loan Amount |
|---|---|---|---|
| Previous Owner | Luengas Ernesto Santiago | $265,800 | |
| Previous Owner | Rivera Teresa | $63,900 |
Source: Public Records
Tax History Compared to Growth
Tax History
| Year | Tax Paid | Tax Assessment Tax Assessment Total Assessment is a certain percentage of the fair market value that is determined by local assessors to be the total taxable value of land and additions on the property. | Land | Improvement |
|---|---|---|---|---|
| 2025 | $5,345 | $204,100 | $76,000 | $128,100 |
| 2024 | $5,190 | $204,100 | $76,000 | $128,100 |
| 2023 | $5,190 | $204,100 | $76,000 | $128,100 |
| 2022 | $5,080 | $204,100 | $76,000 | $128,100 |
| 2021 | $5,060 | $204,100 | $76,000 | $128,100 |
| 2020 | $5,041 | $204,100 | $76,000 | $128,100 |
| 2019 | $4,945 | $204,100 | $76,000 | $128,100 |
| 2018 | $4,833 | $204,100 | $76,000 | $128,100 |
| 2017 | $4,641 | $204,100 | $76,000 | $128,100 |
| 2016 | $5,133 | $87,500 | $25,000 | $62,500 |
| 2015 | $5,010 | $87,500 | $25,000 | $62,500 |
| 2014 | $4,921 | $87,500 | $25,000 | $62,500 |
Source: Public Records
Map
Nearby Homes
- 268 Somerset St
- 8 James St
- 238 Somerset St
- 47 Jersey Ave
- 86 Harvey St
- 357 Somerset St
- 375 Delavan St
- 290 Redmond St
- 114 Joyce Kilmer Ave
- 267 Handy St
- 17 Woodbridge St
- 264 Seaman St
- 163 Livingston Ave
- 5 Lorain St
- 93 Easton Ave
- 45 Duke St
- 216 Handy St
- 294 Howard St
- 214 Redmond St
- 110 Somerset St Unit 2114
- 27 Alexander St
- 25 Alexander St
- 276 Somerset St
- 23 Alexander St
- 274 Somerset St
- 32 James St
- 272 Somerset St
- 270 Somerset St
- 30 James St
- 19 Alexander St
- 268 Somerset St Unit 27
- 24 James St
- 28 Alexander St
- 15 Alexander St
- 26 Alexander St
- 22 James St
- 32 Alexander St
- 30 Alexander St
- 24 Alexander St
- 34 Alexander St