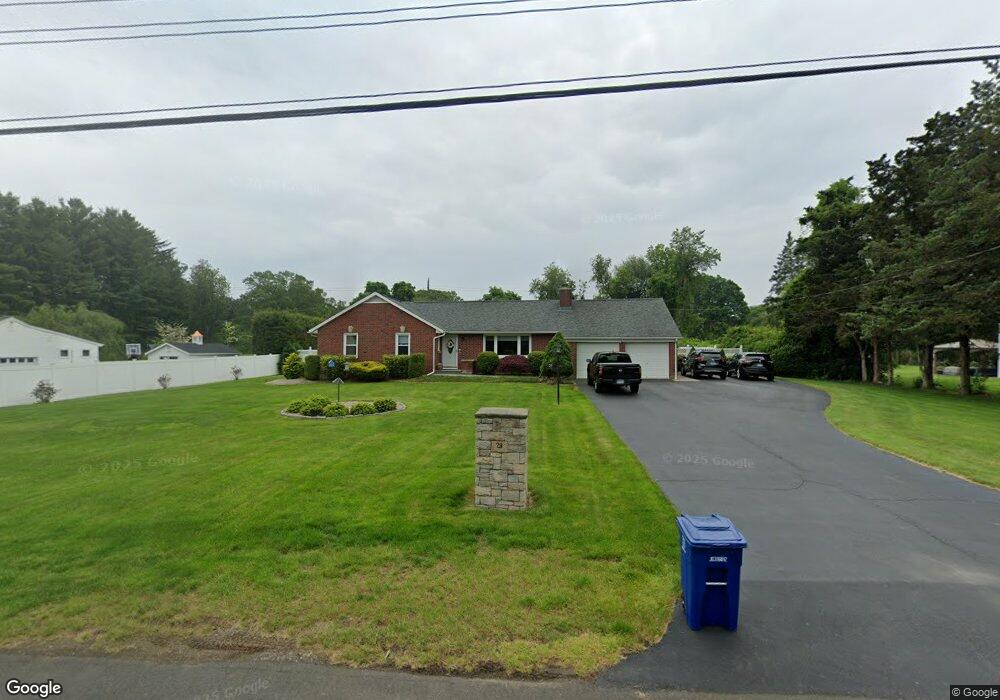
29 Andrew Ln Orange, CT 06477
Estimated Value: $555,888 - $668,000
4
Beds
2
Baths
1,675
Sq Ft
$370/Sq Ft
Est. Value
About This Home
This home is located at 29 Andrew Ln, Orange, CT 06477 and is currently estimated at $619,722, approximately $369 per square foot. 29 Andrew Ln is a home located in New Haven County with nearby schools including Mary L. Tracy School, Race Brook School, and Amity Middle School: Orange.
Ownership History
Date
Name
Owned For
Owner Type
Purchase Details
Closed on
Aug 5, 2024
Sold by
Esposito Francis L and Esposito Joyce M
Bought by
Esposito Ft and Esposito
Current Estimated Value
Purchase Details
Closed on
May 1, 1987
Sold by
Zimkus Joseph J
Bought by
Esposito Francis L
Home Financials for this Owner
Home Financials are based on the most recent Mortgage that was taken out on this home.
Original Mortgage
$70,000
Interest Rate
8.99%
Mortgage Type
Purchase Money Mortgage
Create a Home Valuation Report for This Property
The Home Valuation Report is an in-depth analysis detailing your home's value as well as a comparison with similar homes in the area
Home Values in the Area
Average Home Value in this Area
Purchase History
| Date | Buyer | Sale Price | Title Company |
|---|---|---|---|
| Esposito Ft | -- | None Available | |
| Esposito Ft | -- | None Available | |
| Esposito Francis L | $24,000 | -- |
Source: Public Records
Mortgage History
| Date | Status | Borrower | Loan Amount |
|---|---|---|---|
| Previous Owner | Esposito Francis L | $205,000 | |
| Previous Owner | Esposito Francis L | $103,000 | |
| Previous Owner | Esposito Francis L | $70,000 | |
| Previous Owner | Esposito Francis L | $70,000 |
Source: Public Records
Tax History
| Year | Tax Paid | Tax Assessment Tax Assessment Total Assessment is a certain percentage of the fair market value that is determined by local assessors to be the total taxable value of land and additions on the property. | Land | Improvement |
|---|---|---|---|---|
| 2025 | $9,082 | $312,100 | $189,500 | $122,600 |
| 2024 | $9,675 | $312,100 | $189,500 | $122,600 |
| 2023 | $7,535 | $233,200 | $138,300 | $94,900 |
| 2022 | $7,628 | $233,200 | $138,300 | $94,900 |
| 2021 | $7,754 | $233,200 | $138,300 | $94,900 |
| 2020 | $7,635 | $233,200 | $138,300 | $94,900 |
| 2019 | $7,600 | $233,200 | $138,300 | $94,900 |
| 2018 | $7,462 | $233,200 | $138,300 | $94,900 |
| 2017 | $7,365 | $221,300 | $125,000 | $96,300 |
| 2016 | $7,126 | $221,300 | $125,000 | $96,300 |
| 2015 | $6,949 | $221,300 | $125,000 | $96,300 |
| 2014 | $6,750 | $221,300 | $125,000 | $96,300 |
Source: Public Records
Map
Nearby Homes
- 84 Chelsea Ct
- 148 Kennedy Dr
- 424 Racebrook Rd
- 588 Summit Dr
- 181 Hadley Rd
- 24 Brierwood Dr
- 846 Beechwood Rd
- 149 Canton St Unit 30
- 149 Canton St Unit 18
- 7 Ipswich St
- 920 Green Cir
- 11 Williamsburg Dr
- 96 Medford St
- 1025 Field Dr
- 45 Swampscott St
- 155 Bull Hill Ln Unit 201
- 47 Dix St
- 830 Bayberry Ln
- 157 Bull Hill Ln Unit 102
- 63 Cynthia Dr
Your Personal Tour Guide
Ask me questions while you tour the home.