Estimated Value: $326,279 - $352,000
3
Beds
1
Bath
1,056
Sq Ft
$319/Sq Ft
Est. Value
About This Home
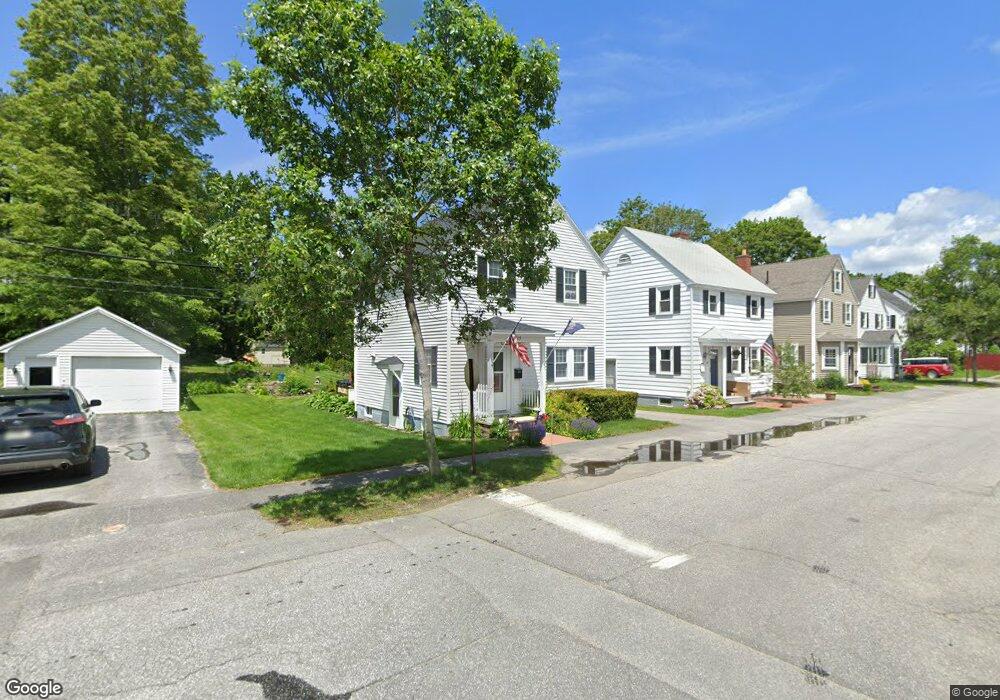
This home is located at 29 Andrews Rd, Bath, ME 04530 and is currently estimated at $336,570, approximately $318 per square foot. 29 Andrews Rd is a home located in Sagadahoc County with nearby schools including Morse High School and Hyde School.
Ownership History
Date
Name
Owned For
Owner Type
Purchase Details
Closed on
Oct 27, 2025
Sold by
Brown Kathleen A
Bought by
Brown Kathleen A and Brown William D
Current Estimated Value
Purchase Details
Closed on
Mar 25, 2019
Sold by
Crabtree Richard C
Bought by
Brown Kathleen
Home Financials for this Owner
Home Financials are based on the most recent Mortgage that was taken out on this home.
Original Mortgage
$140,000
Interest Rate
4.4%
Mortgage Type
New Conventional
Purchase Details
Closed on
Nov 25, 2009
Sold by
Flaherty Sandra J Est and Flaherty
Bought by
Crabtree R Christian R and Crabtree Kathleen A
Home Financials for this Owner
Home Financials are based on the most recent Mortgage that was taken out on this home.
Original Mortgage
$126,663
Interest Rate
4.92%
Mortgage Type
FHA
Create a Home Valuation Report for This Property
The Home Valuation Report is an in-depth analysis detailing your home's value as well as a comparison with similar homes in the area
Home Values in the Area
Average Home Value in this Area
Purchase History
| Date | Buyer | Sale Price | Title Company |
|---|---|---|---|
| Brown Kathleen A | -- | -- | |
| Brown Kathleen A | -- | -- | |
| Brown Kathleen | -- | -- | |
| Brown Kathleen | -- | -- | |
| Crabtree R Christian R | -- | -- |
Source: Public Records
Mortgage History
| Date | Status | Borrower | Loan Amount |
|---|---|---|---|
| Previous Owner | Brown Kathleen | $140,000 | |
| Previous Owner | Crabtree R Christian R | $126,663 |
Source: Public Records
Tax History
| Year | Tax Paid | Tax Assessment Tax Assessment Total Assessment is a certain percentage of the fair market value that is determined by local assessors to be the total taxable value of land and additions on the property. | Land | Improvement |
|---|---|---|---|---|
| 2025 | $4,268 | $265,100 | $55,200 | $209,900 |
| 2024 | $3,919 | $237,500 | $59,600 | $177,900 |
| 2023 | $3,326 | $196,800 | $44,300 | $152,500 |
| 2022 | $3,199 | $156,800 | $34,900 | $121,900 |
| 2021 | $3,183 | $156,800 | $34,900 | $121,900 |
| 2020 | $3,136 | $156,800 | $34,900 | $121,900 |
| 2019 | $3,105 | $156,800 | $34,900 | $121,900 |
| 2018 | $2,666 | $122,300 | $24,000 | $98,300 |
| 2017 | $2,611 | $122,300 | $24,000 | $98,300 |
| 2016 | $2,581 | $122,300 | $24,000 | $98,300 |
| 2015 | $2,532 | $122,300 | $24,000 | $98,300 |
| 2014 | $2,470 | $122,300 | $24,000 | $98,300 |
| 2013 | $2,402 | $122,300 | $24,000 | $98,300 |
Source: Public Records
Map
Nearby Homes
Your Personal Tour Guide
Ask me questions while you tour the home.