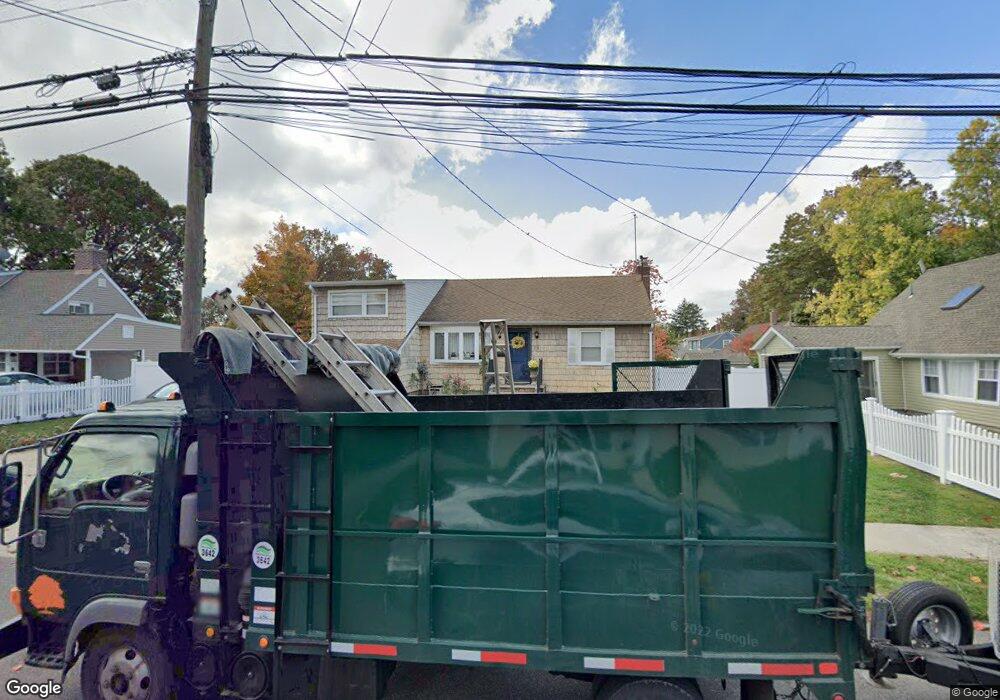
29 Arlington St Westbury, NY 11590
Estimated Value: $575,557 - $641,000
--
Bed
--
Bath
1,162
Sq Ft
$523/Sq Ft
Est. Value
About This Home
This home is located at 29 Arlington St, Westbury, NY 11590 and is currently estimated at $608,279, approximately $523 per square foot. 29 Arlington St is a home located in Nassau County with nearby schools including Westbury Middle School, Westbury High School, and Westbury Friends School.
Ownership History
Date
Name
Owned For
Owner Type
Purchase Details
Closed on
Mar 9, 2020
Sold by
Pierre Marie V and Saintil Nesley Y
Bought by
Pierre Marie V
Current Estimated Value
Purchase Details
Closed on
Dec 31, 2018
Sold by
Bml Properties Llc
Bought by
Pierrere Marie V and Saintil Nesley
Home Financials for this Owner
Home Financials are based on the most recent Mortgage that was taken out on this home.
Original Mortgage
$417,302
Outstanding Balance
$373,283
Interest Rate
5.5%
Mortgage Type
FHA
Estimated Equity
$234,996
Purchase Details
Closed on
Jul 30, 2018
Sold by
Copeland Jeanette M and Copeland Elizabeth M
Bought by
Bmk Properties Llc
Home Financials for this Owner
Home Financials are based on the most recent Mortgage that was taken out on this home.
Original Mortgage
$232,500
Interest Rate
4.5%
Mortgage Type
Commercial
Purchase Details
Closed on
May 8, 2003
Sold by
Copeland Patricia
Create a Home Valuation Report for This Property
The Home Valuation Report is an in-depth analysis detailing your home's value as well as a comparison with similar homes in the area
Home Values in the Area
Average Home Value in this Area
Purchase History
| Date | Buyer | Sale Price | Title Company |
|---|---|---|---|
| Pierre Marie V | -- | None Available | |
| Pierrere Marie V | $425,000 | Judicial Title | |
| Bmk Properties Llc | $250,000 | Fidelity National Title | |
| -- | $250,000 | -- |
Source: Public Records
Mortgage History
| Date | Status | Borrower | Loan Amount |
|---|---|---|---|
| Open | Pierrere Marie V | $417,302 | |
| Previous Owner | Bmk Properties Llc | $232,500 |
Source: Public Records
Tax History Compared to Growth
Tax History
| Year | Tax Paid | Tax Assessment Tax Assessment Total Assessment is a certain percentage of the fair market value that is determined by local assessors to be the total taxable value of land and additions on the property. | Land | Improvement |
|---|---|---|---|---|
| 2025 | $9,016 | $305 | $181 | $124 |
| 2024 | $2,256 | $305 | $181 | $124 |
| 2023 | $9,905 | $305 | $181 | $124 |
| 2022 | $9,905 | $305 | $181 | $124 |
| 2021 | $10,612 | $305 | $181 | $124 |
| 2020 | $474 | $655 | $524 | $131 |
| 2019 | $9,330 | $655 | $524 | $131 |
| 2018 | $9,330 | $655 | $0 | $0 |
| 2017 | $6,693 | $655 | $524 | $131 |
| 2016 | $9,023 | $655 | $524 | $131 |
| 2015 | $2,228 | $655 | $524 | $131 |
| 2014 | $2,228 | $655 | $524 | $131 |
| 2013 | $2,087 | $655 | $524 | $131 |
Source: Public Records
Map
Nearby Homes
- 671 Whittier St
- 646 Whittier St
- 806 Oliver Ave
- 906 Bromton Dr
- 9 Grayston St
- 20 Longfellow Ave
- 1148 Howard Dr
- 868 Oliver Ave
- 921 Wellington Rd
- 2040 Wellington Ct
- 1067 Mirabelle Ave
- 899 Old Country Rd
- 2001 Wellington Ct
- 254 Brook St
- 690 Edgewood Dr
- 780 Regent Dr
- 263 Siegel St
- 266 Covert St
- 1057 Grand Blvd
- 1982 Stratford Dr
- 29 Arlington St
- 31 Arlington St
- 25 Arlington St
- 703 Whittier St
- 702 Whittier St
- 33 Arlington St
- 23 Arlington St
- 28 Arlington St
- 695 Whittier St
- 26 Arlington St
- 694 Whittier St
- 35 Arlington St
- 30 Arlington St
- 24 Arlington St
- 703 Bryant St
- 702 Irving St
- 32 Arlington St
- 21 Arlington St
- 689 Whittier St
- 37 Arlington St