29 Ash St W Three Oaks, MI 49128
Estimated Value: $319,696 - $423,000
3
Beds
3
Baths
1,903
Sq Ft
$195/Sq Ft
Est. Value
About This Home
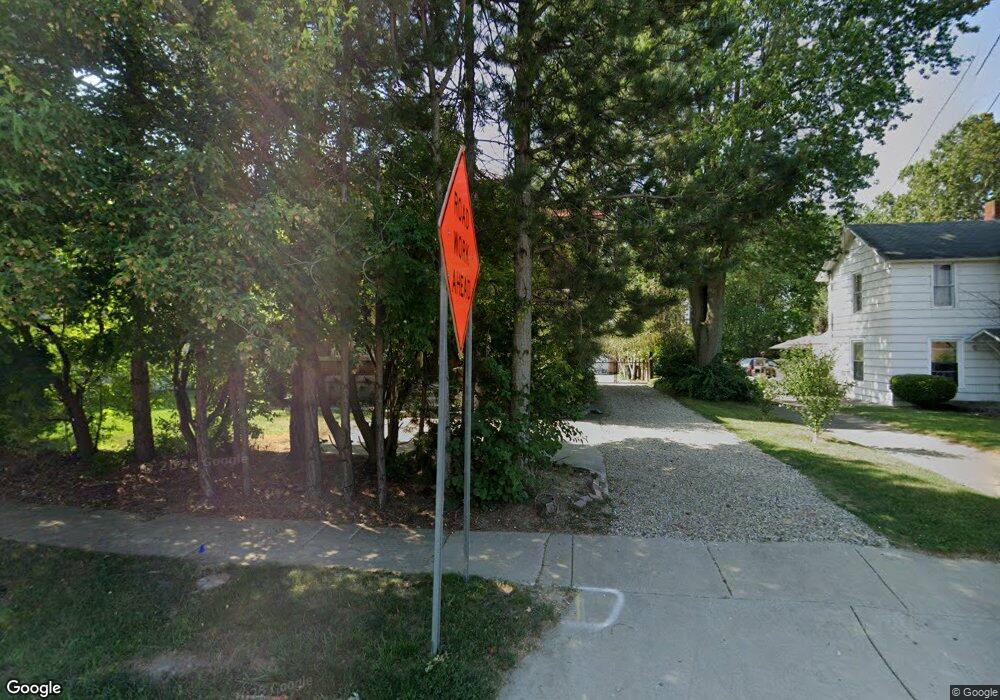
This home is located at 29 Ash St W, Three Oaks, MI 49128 and is currently estimated at $371,674, approximately $195 per square foot. 29 Ash St W is a home located in Berrien County with nearby schools including River Valley Middle/High School and Lutie High School.
Ownership History
Date
Name
Owned For
Owner Type
Purchase Details
Closed on
Apr 11, 2025
Sold by
Bartczyszyn John M
Bought by
Frelier Johannah and Garrett Joseph
Current Estimated Value
Home Financials for this Owner
Home Financials are based on the most recent Mortgage that was taken out on this home.
Original Mortgage
$315,250
Outstanding Balance
$309,679
Interest Rate
5.79%
Mortgage Type
New Conventional
Estimated Equity
$61,995
Purchase Details
Closed on
Jul 12, 1996
Purchase Details
Closed on
Jun 2, 1993
Purchase Details
Closed on
Oct 17, 1992
Purchase Details
Closed on
Dec 27, 1984
Create a Home Valuation Report for This Property
The Home Valuation Report is an in-depth analysis detailing your home's value as well as a comparison with similar homes in the area
Home Values in the Area
Average Home Value in this Area
Purchase History
| Date | Buyer | Sale Price | Title Company |
|---|---|---|---|
| Frelier Johannah | -- | None Listed On Document | |
| -- | $95,000 | -- | |
| -- | $62,000 | -- | |
| -- | $62,000 | -- | |
| -- | -- | -- |
Source: Public Records
Mortgage History
| Date | Status | Borrower | Loan Amount |
|---|---|---|---|
| Open | Frelier Johannah | $315,250 |
Source: Public Records
Tax History Compared to Growth
Tax History
| Year | Tax Paid | Tax Assessment Tax Assessment Total Assessment is a certain percentage of the fair market value that is determined by local assessors to be the total taxable value of land and additions on the property. | Land | Improvement |
|---|---|---|---|---|
| 2025 | $1,568 | $136,000 | $0 | $0 |
| 2024 | $1,745 | $123,600 | $0 | $0 |
| 2023 | $1,661 | $117,000 | $0 | $0 |
| 2022 | $1,597 | $103,000 | $0 | $0 |
| 2021 | $2,295 | $72,500 | $11,300 | $61,200 |
| 2020 | $2,148 | $67,800 | $0 | $0 |
| 2019 | $2,061 | $83,300 | $7,900 | $75,400 |
| 2018 | $2,082 | $83,300 | $0 | $0 |
| 2017 | $2,042 | $83,836 | $0 | $0 |
| 2016 | $2,006 | $82,287 | $0 | $0 |
| 2015 | $2,003 | $61,729 | $0 | $0 |
| 2014 | $624 | $57,314 | $0 | $0 |
Source: Public Records
Map
Nearby Homes