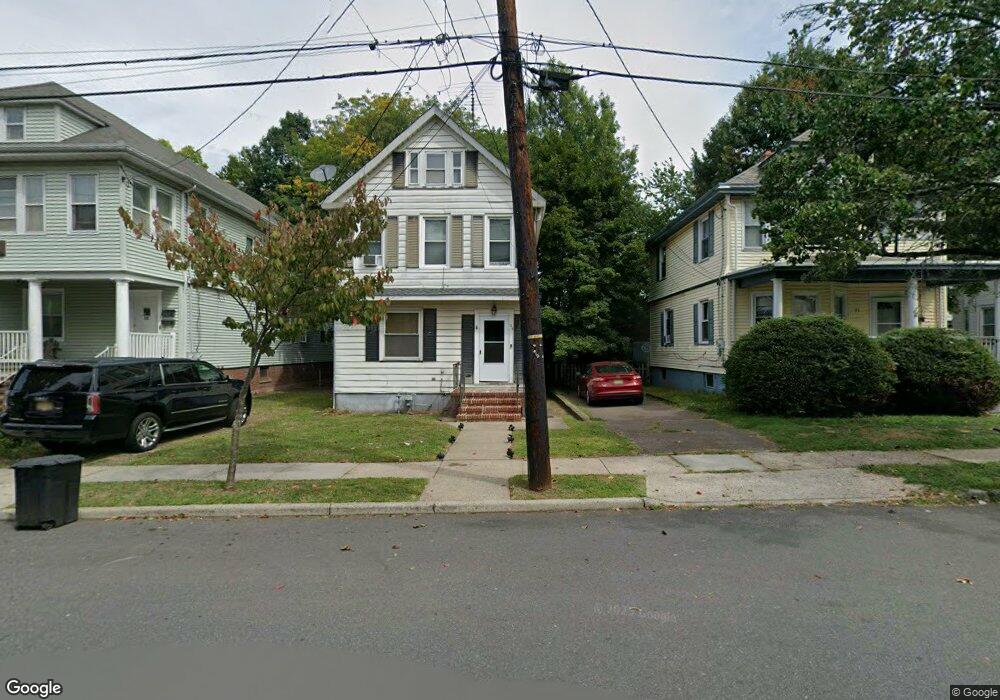
29 Baldwin St New Brunswick, NJ 08901
Estimated Value: $419,591 - $501,000
3
Beds
2
Baths
1,257
Sq Ft
$360/Sq Ft
Est. Value
About This Home
This home is located at 29 Baldwin St, New Brunswick, NJ 08901 and is currently estimated at $452,648, approximately $360 per square foot. 29 Baldwin St is a home located in Middlesex County with nearby schools including New Brunswick High School, Central Jersey College Prep Charter School, and St. Mary of Mount Virgin School.
Ownership History
Date
Name
Owned For
Owner Type
Purchase Details
Closed on
Aug 6, 2018
Sold by
Kindred Real Etsta Ellc
Bought by
Zhang Xiaowu and Li Lan
Current Estimated Value
Home Financials for this Owner
Home Financials are based on the most recent Mortgage that was taken out on this home.
Original Mortgage
$208,875
Outstanding Balance
$181,399
Interest Rate
4.5%
Mortgage Type
New Conventional
Estimated Equity
$271,249
Purchase Details
Closed on
Nov 25, 2011
Bought by
Kindred Real Estate Llc
Purchase Details
Closed on
Mar 8, 2011
Sold by
Mclaurin John and Mclaurin Patressa
Bought by
Liang Sam and Tian Jenny
Purchase Details
Closed on
Sep 28, 2001
Sold by
Voos Kay
Bought by
Mclaurin John and Mclaurin Patressa
Home Financials for this Owner
Home Financials are based on the most recent Mortgage that was taken out on this home.
Original Mortgage
$158,746
Interest Rate
6.7%
Mortgage Type
FHA
Create a Home Valuation Report for This Property
The Home Valuation Report is an in-depth analysis detailing your home's value as well as a comparison with similar homes in the area
Home Values in the Area
Average Home Value in this Area
Purchase History
| Date | Buyer | Sale Price | Title Company |
|---|---|---|---|
| Zhang Xiaowu | $278,500 | First American Title Ins Co | |
| Kindred Real Estate Llc | -- | -- | |
| Liang Sam | $226,000 | Multiple | |
| Mclaurin John | $160,000 | -- |
Source: Public Records
Mortgage History
| Date | Status | Borrower | Loan Amount |
|---|---|---|---|
| Open | Zhang Xiaowu | $208,875 | |
| Previous Owner | Mclaurin John | $158,746 |
Source: Public Records
Tax History Compared to Growth
Tax History
| Year | Tax Paid | Tax Assessment Tax Assessment Total Assessment is a certain percentage of the fair market value that is determined by local assessors to be the total taxable value of land and additions on the property. | Land | Improvement |
|---|---|---|---|---|
| 2025 | $6,393 | $244,100 | $138,500 | $105,600 |
| 2024 | $6,207 | $244,100 | $138,500 | $105,600 |
| 2023 | $6,207 | $244,100 | $138,500 | $105,600 |
| 2022 | $6,076 | $244,100 | $138,500 | $105,600 |
| 2021 | $4,507 | $244,100 | $138,500 | $105,600 |
| 2020 | $6,029 | $244,100 | $138,500 | $105,600 |
| 2019 | $5,915 | $244,100 | $138,500 | $105,600 |
| 2018 | $5,780 | $244,100 | $138,500 | $105,600 |
| 2017 | $5,551 | $244,100 | $138,500 | $105,600 |
| 2016 | $6,318 | $107,700 | $27,900 | $79,800 |
| 2015 | $6,167 | $107,700 | $27,900 | $79,800 |
| 2014 | $6,057 | $107,700 | $27,900 | $79,800 |
Source: Public Records
Map
Nearby Homes
- 79 Nichol Ave
- 55 Suydam St
- 72 Comstock St
- 220 Paul Robeson Blvd
- 97 Throop Ave
- 144 George St
- 92 Paul Robeson Blvd
- 87 Paul Robeson Blvd
- 133 Suydam St
- 146 Seaman St
- 161 George St
- 122B Remsen Ave Unit A
- 122A Remsen Ave Unit A
- 128 Remsen Ave Unit A
- 128A Remsen Ave
- 115 Remsen Ave
- 73 Remsen Ave
- 181 Hale St
- 89 N Talmadge St
- 18 N Talmadge St