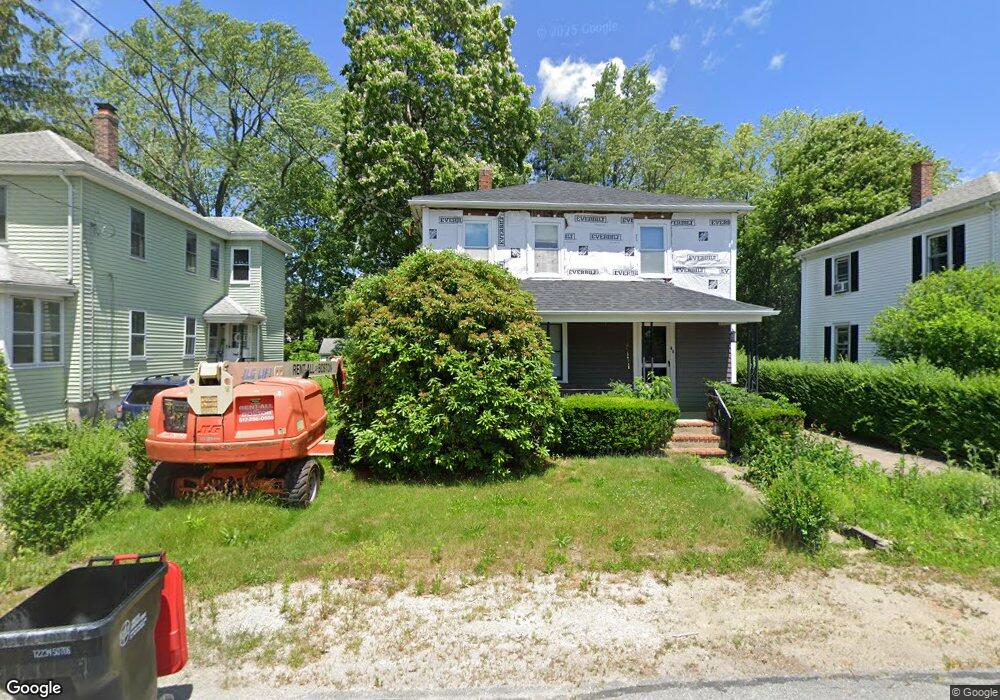
29 Ball Ave Bridgewater, MA 02324
Estimated Value: $474,556 - $593,000
4
Beds
2
Baths
1,432
Sq Ft
$378/Sq Ft
Est. Value
About This Home
This home is located at 29 Ball Ave, Bridgewater, MA 02324 and is currently estimated at $540,639, approximately $377 per square foot. 29 Ball Ave is a home located in Plymouth County with nearby schools including Mitchell Elementary School, Williams Intermediate School, and Bridgewater Middle School.
Ownership History
Date
Name
Owned For
Owner Type
Purchase Details
Closed on
Sep 25, 2025
Sold by
Brown Ft and Brown
Bought by
Brian J Brown Irt and Brown
Current Estimated Value
Purchase Details
Closed on
Jun 14, 2019
Sold by
Nordeen Barbara A and Nordeen Eric E
Bought by
29 Bell Drive Irt and Forni
Purchase Details
Closed on
Jan 8, 2019
Sold by
Brown Clair W and Brown Eileen C
Bought by
Brown Ft and Brown
Create a Home Valuation Report for This Property
The Home Valuation Report is an in-depth analysis detailing your home's value as well as a comparison with similar homes in the area
Home Values in the Area
Average Home Value in this Area
Purchase History
| Date | Buyer | Sale Price | Title Company |
|---|---|---|---|
| Brian J Brown Irt | -- | -- | |
| Brian J Brown Irt | -- | -- | |
| 29 Bell Drive Irt | -- | -- | |
| 29 Bell Drive Irt | -- | -- | |
| Brown Ft | -- | -- | |
| Brown Ft | -- | -- |
Source: Public Records
Tax History
| Year | Tax Paid | Tax Assessment Tax Assessment Total Assessment is a certain percentage of the fair market value that is determined by local assessors to be the total taxable value of land and additions on the property. | Land | Improvement |
|---|---|---|---|---|
| 2025 | $4,817 | $407,200 | $161,900 | $245,300 |
| 2024 | $4,684 | $385,800 | $154,200 | $231,600 |
| 2023 | $4,841 | $377,000 | $160,100 | $216,900 |
| 2022 | $4,744 | $331,300 | $140,500 | $190,800 |
| 2021 | $4,199 | $290,000 | $119,100 | $170,900 |
| 2020 | $3,962 | $269,000 | $114,500 | $154,500 |
| 2019 | $3,716 | $250,600 | $114,500 | $136,100 |
| 2018 | $3,176 | $209,100 | $111,200 | $97,900 |
| 2017 | $3,158 | $202,300 | $111,200 | $91,100 |
| 2016 | $3,072 | $197,700 | $109,100 | $88,600 |
| 2015 | $3,016 | $185,700 | $100,300 | $85,400 |
| 2014 | $2,956 | $181,900 | $97,300 | $84,600 |
Source: Public Records
Map
Nearby Homes
- 459 High St
- 580 Broad St Unit 2
- 580 Broad St Unit 1
- 47 Hale St
- 167 Spring St
- 54 Michael Rd Unit 33
- 48 Wall St
- 180 Main St Unit D80
- 180 Main St Unit 6109
- 180 Main St Unit 1109
- 180 Main St Unit A15
- 180 Main St Unit 4105
- 30 Sanger St
- 0 Bedford St Unit 73480500
- 5 Heather Ln
- 35 Leonard St Unit 3
- 81 Arrowhead Dr
- 603 East St
- 120 Worcester St
- 20 Church Ave
Your Personal Tour Guide
Ask me questions while you tour the home.