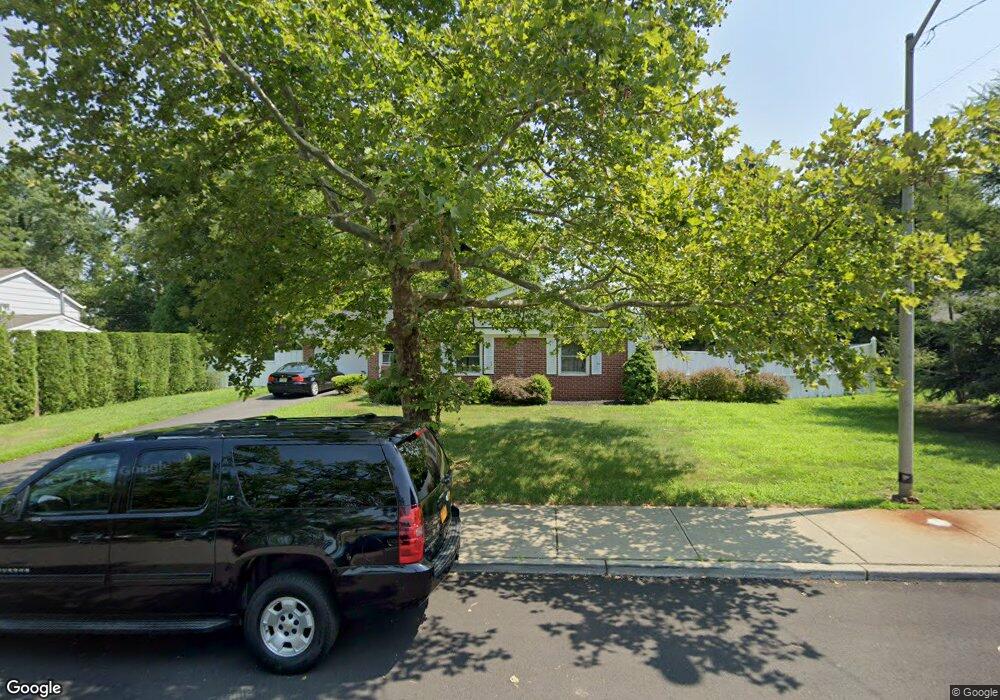
29 Bechstein Dr Matawan, NJ 07747
Estimated Value: $625,000 - $677,000
3
Beds
2
Baths
1,535
Sq Ft
$420/Sq Ft
Est. Value
About This Home
This home is located at 29 Bechstein Dr, Matawan, NJ 07747 and is currently estimated at $645,237, approximately $420 per square foot. 29 Bechstein Dr is a home located in Monmouth County with nearby schools including Matawan Reg High School, Matawan Montessori Academy, and St. Joseph Elementary School.
Ownership History
Date
Name
Owned For
Owner Type
Purchase Details
Closed on
Sep 23, 1998
Sold by
Li Zhen Qin
Bought by
Raince Ichpal Kaur
Current Estimated Value
Home Financials for this Owner
Home Financials are based on the most recent Mortgage that was taken out on this home.
Original Mortgage
$104,000
Outstanding Balance
$21,716
Interest Rate
6.64%
Estimated Equity
$623,521
Purchase Details
Closed on
Mar 28, 1996
Sold by
Colasurdo Jeffrey
Bought by
Li Zhen Qin and Huang Cin Ling
Home Financials for this Owner
Home Financials are based on the most recent Mortgage that was taken out on this home.
Original Mortgage
$104,000
Interest Rate
7.39%
Create a Home Valuation Report for This Property
The Home Valuation Report is an in-depth analysis detailing your home's value as well as a comparison with similar homes in the area
Home Values in the Area
Average Home Value in this Area
Purchase History
| Date | Buyer | Sale Price | Title Company |
|---|---|---|---|
| Raince Ichpal Kaur | $130,000 | -- | |
| Li Zhen Qin | $139,000 | -- |
Source: Public Records
Mortgage History
| Date | Status | Borrower | Loan Amount |
|---|---|---|---|
| Open | Raince Ichpal Kaur | $104,000 | |
| Previous Owner | Li Zhen Qin | $104,000 |
Source: Public Records
Tax History
| Year | Tax Paid | Tax Assessment Tax Assessment Total Assessment is a certain percentage of the fair market value that is determined by local assessors to be the total taxable value of land and additions on the property. | Land | Improvement |
|---|---|---|---|---|
| 2025 | $10,386 | $585,000 | $444,000 | $141,000 |
| 2024 | $9,884 | $513,900 | $375,500 | $138,400 |
| 2023 | $9,884 | $462,100 | $327,000 | $135,100 |
| 2022 | $8,668 | $385,200 | $256,500 | $128,700 |
| 2021 | $8,668 | $347,100 | $232,700 | $114,400 |
| 2020 | $9,898 | $364,700 | $242,700 | $122,000 |
| 2019 | $9,779 | $350,000 | $228,700 | $121,300 |
| 2018 | $9,362 | $335,900 | $220,200 | $115,700 |
| 2017 | $8,733 | $317,800 | $200,200 | $117,600 |
| 2016 | $8,131 | $308,800 | $194,200 | $114,600 |
| 2015 | $8,583 | $312,900 | $201,200 | $111,700 |
| 2014 | $8,153 | $303,100 | $192,200 | $110,900 |
Source: Public Records
Map
Nearby Homes
Your Personal Tour Guide
Ask me questions while you tour the home.