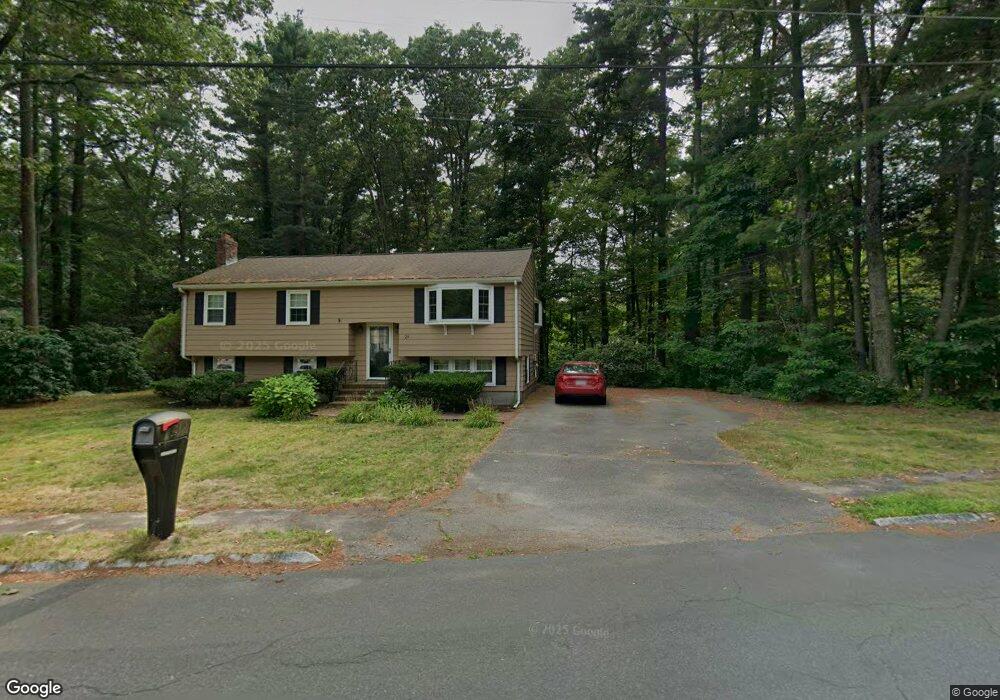
29 Bicknell St Foxboro, MA 02035
Estimated Value: $595,784 - $817,000
4
Beds
2
Baths
2,300
Sq Ft
$301/Sq Ft
Est. Value
About This Home
This home is located at 29 Bicknell St, Foxboro, MA 02035 and is currently estimated at $692,696, approximately $301 per square foot. 29 Bicknell St is a home located in Norfolk County with nearby schools including Foxborough High School, Discovery Daycare Center, and Hands-On-Montessori School.
Ownership History
Date
Name
Owned For
Owner Type
Purchase Details
Closed on
Apr 30, 2010
Sold by
Madden Daniel J and Madden Patricia M
Bought by
Taylor Jeffrey M and Taylor Karen E
Current Estimated Value
Home Financials for this Owner
Home Financials are based on the most recent Mortgage that was taken out on this home.
Original Mortgage
$367,012
Outstanding Balance
$245,269
Interest Rate
4.99%
Mortgage Type
Purchase Money Mortgage
Estimated Equity
$447,427
Create a Home Valuation Report for This Property
The Home Valuation Report is an in-depth analysis detailing your home's value as well as a comparison with similar homes in the area
Home Values in the Area
Average Home Value in this Area
Purchase History
| Date | Buyer | Sale Price | Title Company |
|---|---|---|---|
| Taylor Jeffrey M | $380,000 | -- |
Source: Public Records
Mortgage History
| Date | Status | Borrower | Loan Amount |
|---|---|---|---|
| Open | Taylor Jeffrey M | $367,012 |
Source: Public Records
Tax History Compared to Growth
Tax History
| Year | Tax Paid | Tax Assessment Tax Assessment Total Assessment is a certain percentage of the fair market value that is determined by local assessors to be the total taxable value of land and additions on the property. | Land | Improvement |
|---|---|---|---|---|
| 2025 | $7,251 | $548,500 | $239,700 | $308,800 |
| 2024 | $7,004 | $518,400 | $244,000 | $274,400 |
| 2023 | $6,814 | $479,500 | $232,300 | $247,200 |
| 2022 | $6,231 | $429,100 | $194,800 | $234,300 |
| 2021 | $5,836 | $395,900 | $180,400 | $215,500 |
| 2020 | $5,449 | $374,000 | $180,400 | $193,600 |
| 2019 | $5,324 | $362,200 | $171,800 | $190,400 |
| 2018 | $5,187 | $356,000 | $171,800 | $184,200 |
| 2017 | $5,065 | $336,800 | $160,500 | $176,300 |
| 2016 | $5,157 | $348,000 | $161,800 | $186,200 |
| 2015 | $4,955 | $326,200 | $136,800 | $189,400 |
| 2014 | $4,756 | $317,300 | $127,900 | $189,400 |
Source: Public Records
Map
Nearby Homes
- 24 Maverick Dr
- 16 Treasure Island Rd
- 85 Jewell St
- 93 Plain St
- 46 Mirimichi St
- 9 Oak Dr
- 78 Old Farm Rd
- 150 Gilbert St
- 356 Central St
- 14 Claire Ave
- 155 South St
- 152 Central St
- 116 George St
- 166 Chauncy St
- 12 Spring St
- 73-75 Draper Ave
- 150 Rumford Ave Unit 110
- 233 Central St
- 126 Washington St
- 130 Washington St