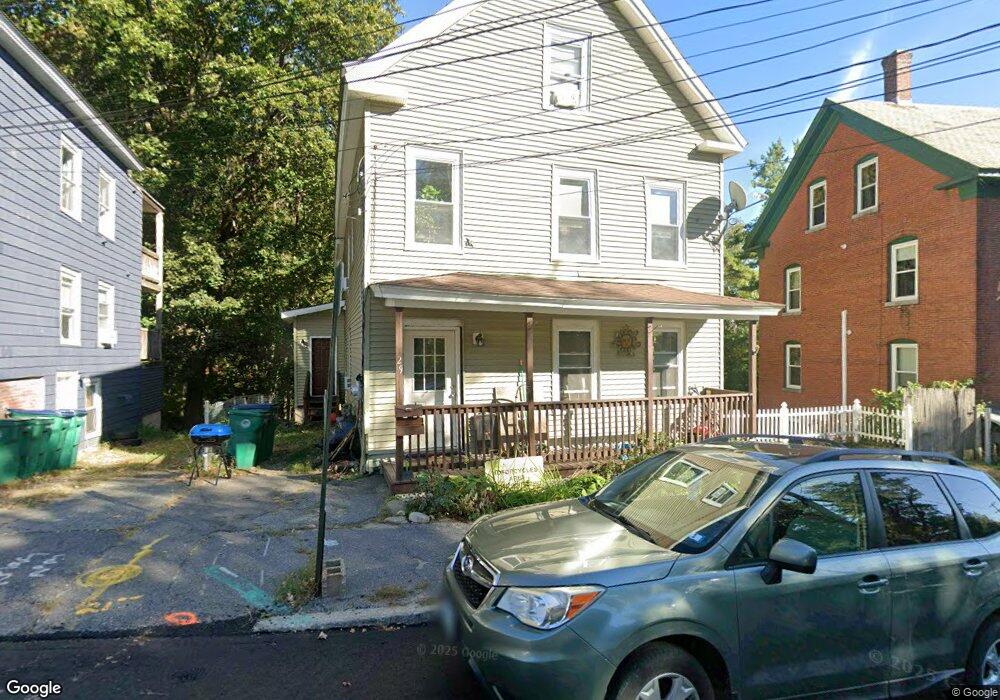
29 Bond St Fitchburg, MA 01420
Estimated Value: $367,000 - $443,000
5
Beds
2
Baths
2,100
Sq Ft
$198/Sq Ft
Est. Value
About This Home
This home is located at 29 Bond St, Fitchburg, MA 01420 and is currently estimated at $416,017, approximately $198 per square foot. 29 Bond St is a home located in Worcester County with nearby schools including Crocker Elementary School, South Street Elementary School, and Reingold Elementary School.
Ownership History
Date
Name
Owned For
Owner Type
Purchase Details
Closed on
Aug 14, 2017
Sold by
King Joseph C and King Tina M
Bought by
King Tina M
Current Estimated Value
Purchase Details
Closed on
Jun 8, 1999
Sold by
Lahti Erick L and Lahti Erika
Bought by
King Joseph L and King Tina M
Home Financials for this Owner
Home Financials are based on the most recent Mortgage that was taken out on this home.
Original Mortgage
$88,250
Interest Rate
6.85%
Mortgage Type
Purchase Money Mortgage
Purchase Details
Closed on
Nov 20, 1992
Sold by
G E Company Emp Fcu
Bought by
Lahti Eric L and Lahti Erika
Home Financials for this Owner
Home Financials are based on the most recent Mortgage that was taken out on this home.
Original Mortgage
$70,000
Interest Rate
7.95%
Mortgage Type
Purchase Money Mortgage
Purchase Details
Closed on
Jul 1, 1992
Sold by
Peters Henry L
Bought by
G E Company Emp Fcu
Create a Home Valuation Report for This Property
The Home Valuation Report is an in-depth analysis detailing your home's value as well as a comparison with similar homes in the area
Home Values in the Area
Average Home Value in this Area
Purchase History
| Date | Buyer | Sale Price | Title Company |
|---|---|---|---|
| King Tina M | -- | -- | |
| King Joseph L | $89,000 | -- | |
| Lahti Eric L | $35,000 | -- | |
| G E Company Emp Fcu | $45,000 | -- |
Source: Public Records
Mortgage History
| Date | Status | Borrower | Loan Amount |
|---|---|---|---|
| Previous Owner | G E Company Emp Fcu | $88,250 | |
| Previous Owner | G E Company Emp Fcu | $70,000 | |
| Previous Owner | G E Company Emp Fcu | $45,000 | |
| Previous Owner | G E Company Emp Fcu | $30,000 |
Source: Public Records
Tax History Compared to Growth
Tax History
| Year | Tax Paid | Tax Assessment Tax Assessment Total Assessment is a certain percentage of the fair market value that is determined by local assessors to be the total taxable value of land and additions on the property. | Land | Improvement |
|---|---|---|---|---|
| 2025 | $50 | $366,400 | $85,800 | $280,600 |
| 2024 | $4,613 | $311,500 | $50,600 | $260,900 |
| 2023 | $4,224 | $263,700 | $38,800 | $224,900 |
| 2022 | $3,874 | $220,000 | $34,100 | $185,900 |
| 2021 | $4,696 | $192,600 | $25,900 | $166,700 |
| 2020 | $18 | $172,700 | $21,200 | $151,500 |
| 2019 | $2,178 | $155,500 | $29,400 | $126,100 |
| 2018 | $3,000 | $142,800 | $27,100 | $115,700 |
| 2017 | $2,729 | $127,000 | $24,700 | $102,300 |
| 2016 | $2,696 | $127,000 | $24,700 | $102,300 |
| 2015 | $2,548 | $123,200 | $25,900 | $97,300 |
| 2014 | $2,483 | $125,200 | $25,900 | $99,300 |
Source: Public Records
Map
Nearby Homes
- 59 Arlington St
- 47 Arlington St
- 58 Arlington St Unit 60
- 39 Arlington St
- 13-15 Chestnut St
- 90 Mechanic St
- 151 Mechanic St
- 33-35 Omena Place
- 68 Marshall St
- 205-207 High St
- 230 Kimball St
- 62 Grove St
- 7 Valleyview Ct Unit 3
- 195 Marshall St
- 218 Marshall St
- 11 Beech Street Ln
- 79 Beech St
- 58 Oliver St
- 5 Jay St
- 0 River St
- 29 Bond St Unit 1
- 27 Bond St
- 32 Bond St
- 7 Crescent Heights
- 36 Bond St
- 19 Bond St Unit 19
- 17 Bond St Unit 19
- 17-19 Bond St
- 48 Chestnut St
- 42 Chestnut St
- 8 Crescent Heights
- 19 Crescent Heights
- 45 Arlington St
- 44 Bond St
- 36 Chestnut St
- 49 Arlington St
- 41 Arlington St
- 41 Arlington St Unit 2
- 52 School St
- 25 Crescent Heights