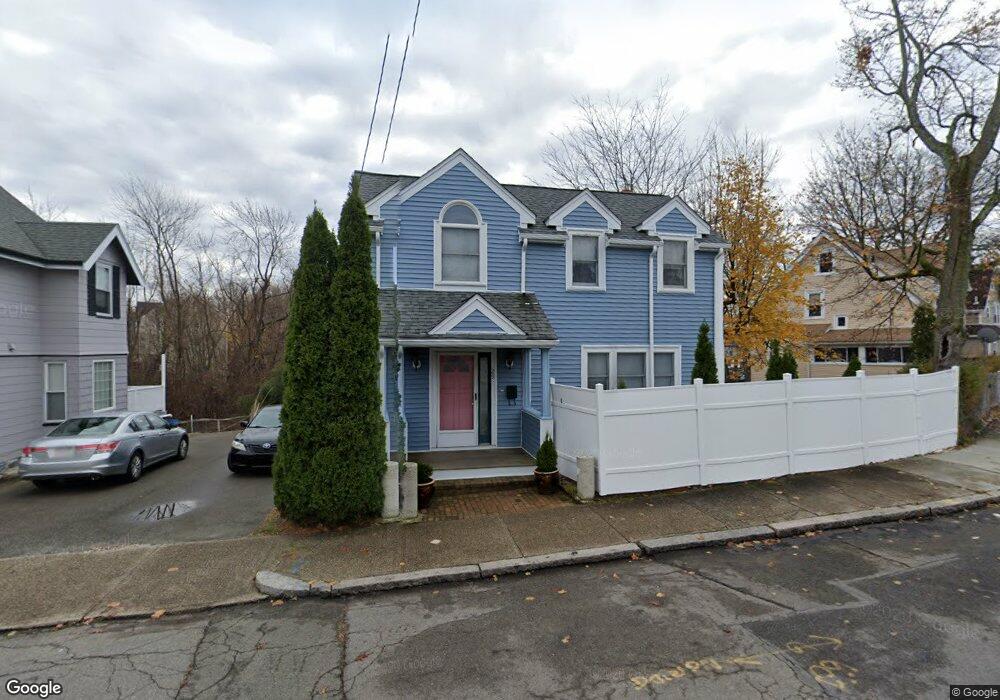
29 Botolph St Quincy, MA 02171
North Quincy NeighborhoodEstimated Value: $745,000 - $848,674
3
Beds
3
Baths
1,925
Sq Ft
$414/Sq Ft
Est. Value
About This Home
This home is located at 29 Botolph St, Quincy, MA 02171 and is currently estimated at $797,169, approximately $414 per square foot. 29 Botolph St is a home located in Norfolk County with nearby schools including Francis W. Parker Elementary School, Atlantic Middle School, and North Quincy High School.
Ownership History
Date
Name
Owned For
Owner Type
Purchase Details
Closed on
Jan 10, 2023
Sold by
Kwan Oi P and Kwan Kit S
Bought by
Kwan Wallace and Kwan Hugo M
Current Estimated Value
Purchase Details
Closed on
Oct 9, 1996
Sold by
Flynn Daniel J
Bought by
Kwan Oi P and Kwan Kit S
Create a Home Valuation Report for This Property
The Home Valuation Report is an in-depth analysis detailing your home's value as well as a comparison with similar homes in the area
Home Values in the Area
Average Home Value in this Area
Purchase History
| Date | Buyer | Sale Price | Title Company |
|---|---|---|---|
| Kwan Wallace | -- | None Available | |
| Kwan Oi P | $173,000 | -- |
Source: Public Records
Mortgage History
| Date | Status | Borrower | Loan Amount |
|---|---|---|---|
| Previous Owner | Kwan Oi P | $50,000 | |
| Previous Owner | Kwan Oi P | $103,500 | |
| Previous Owner | Kwan Oi P | $30,000 |
Source: Public Records
Tax History
| Year | Tax Paid | Tax Assessment Tax Assessment Total Assessment is a certain percentage of the fair market value that is determined by local assessors to be the total taxable value of land and additions on the property. | Land | Improvement |
|---|---|---|---|---|
| 2025 | $9,860 | $855,200 | $347,000 | $508,200 |
| 2024 | $9,419 | $835,800 | $347,000 | $488,800 |
| 2023 | $8,664 | $778,400 | $315,500 | $462,900 |
| 2022 | $8,694 | $725,700 | $252,400 | $473,300 |
| 2021 | $8,026 | $661,100 | $252,400 | $408,700 |
| 2020 | $7,901 | $635,600 | $247,400 | $388,200 |
| 2019 | $7,778 | $619,800 | $237,900 | $381,900 |
| 2018 | $7,616 | $570,900 | $226,600 | $344,300 |
| 2017 | $7,442 | $525,200 | $206,000 | $319,200 |
| 2016 | $6,916 | $481,600 | $187,200 | $294,400 |
| 2015 | $6,602 | $452,200 | $170,200 | $282,000 |
| 2014 | $6,301 | $424,000 | $170,200 | $253,800 |
Source: Public Records
Map
Nearby Homes
- 85 E Squantum St Unit 10
- 201 Billings St
- 175 Quincy Shore Dr Unit B24
- 175 Quincy Shore Dr Unit B23
- 297 Billings St
- 90 Quincy Shore Dr Unit 721
- 90 Quincy Shore Dr Unit 501
- 138 Quincy Shore Dr Unit 170
- 212 Quincy Shore Dr
- 133 Commander Shea Blvd Unit 502
- 133 Commander Shea Blvd Unit 709
- 17 Holmes St Unit 204
- 17 Holmes St Unit 2
- 17 Holmes St Unit 1
- 142 Quincy Shore Dr Unit 142
- 27 Herbert Rd
- 28 Apthorp St
- 70 Walnut St
- 115 W Squantum St Unit 517
- 115 W Squantum St Unit 811
- 35 Botolph St
- 23 Botolph St
- 39 Botolph St
- 30 Clive St
- 30 Clive St Unit 2
- 19 Botolph St
- 43 Botolph St
- 47 Botolph St Unit 1
- 47 Botolph St Unit 1/F
- 46 Botolph St
- 15 Botolph St
- 45 Botolph St
- 47-49 Botolph St Unit 49
- 47-49 Botolph St
- 45 Botolph St Unit 2
- 25 Clive St
- 24 Clive St
- 11 Botolph St
- 11 Botolph St Unit 1
- 11 Botolph St Unit 2
Your Personal Tour Guide
Ask me questions while you tour the home.