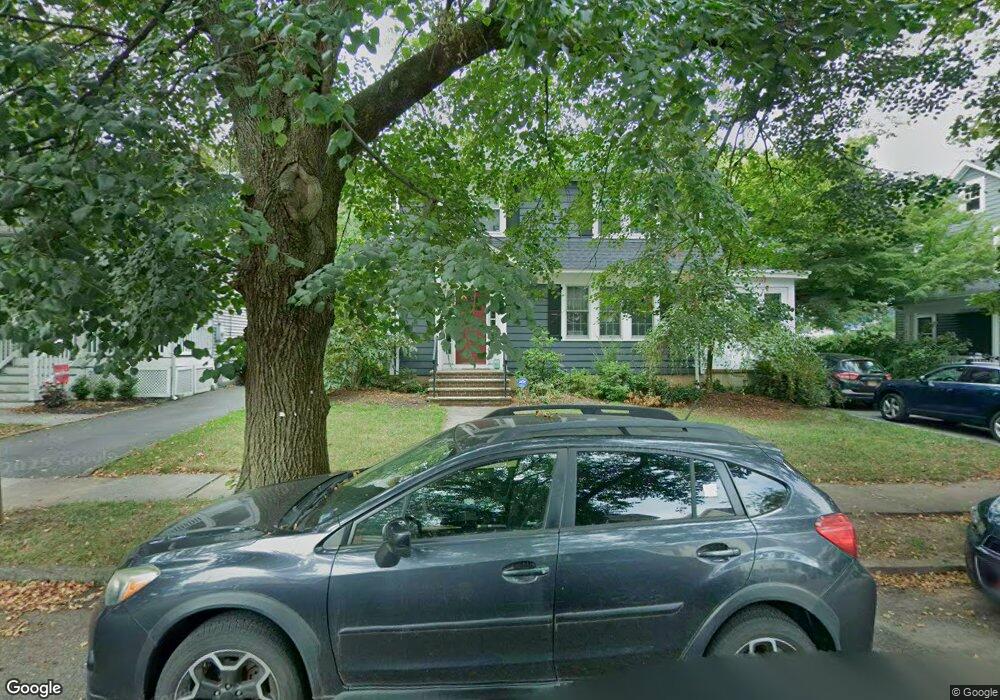
29 Bounty St Metuchen, NJ 08840
Estimated Value: $724,000 - $944,000
--
Bed
--
Bath
1,680
Sq Ft
$509/Sq Ft
Est. Value
About This Home
This home is located at 29 Bounty St, Metuchen, NJ 08840 and is currently estimated at $854,864, approximately $508 per square foot. 29 Bounty St is a home located in Middlesex County with nearby schools including Edgar Middle School, Campbell Elementary School, and Metuchen High School.
Ownership History
Date
Name
Owned For
Owner Type
Purchase Details
Closed on
May 19, 2017
Sold by
Harrison Ronald E
Bought by
Harrison Katherine Y
Current Estimated Value
Purchase Details
Closed on
Oct 14, 2007
Sold by
Harrison Katherine Y
Bought by
Harrison Ronald E and Harrison Katherine Y
Purchase Details
Closed on
Jun 3, 2004
Sold by
Casarico Peter M
Bought by
Harrison Ronald E
Home Financials for this Owner
Home Financials are based on the most recent Mortgage that was taken out on this home.
Original Mortgage
$470,000
Outstanding Balance
$231,601
Interest Rate
6.12%
Estimated Equity
$623,263
Purchase Details
Closed on
May 30, 1997
Sold by
Fevola Simone
Bought by
Casarico Peter and Casarico Stacye
Home Financials for this Owner
Home Financials are based on the most recent Mortgage that was taken out on this home.
Original Mortgage
$209,000
Interest Rate
7.97%
Create a Home Valuation Report for This Property
The Home Valuation Report is an in-depth analysis detailing your home's value as well as a comparison with similar homes in the area
Home Values in the Area
Average Home Value in this Area
Purchase History
| Date | Buyer | Sale Price | Title Company |
|---|---|---|---|
| Harrison Katherine Y | -- | Title Source Inc | |
| Harrison Katherine Y | -- | Title Source Inc | |
| Harrison Ronald E | -- | Multiple | |
| Harrison Ronald E | $648,000 | -- | |
| Casarico Peter | $232,000 | -- |
Source: Public Records
Mortgage History
| Date | Status | Borrower | Loan Amount |
|---|---|---|---|
| Open | Harrison Ronald E | $470,000 | |
| Previous Owner | Casarico Peter | $209,000 |
Source: Public Records
Tax History Compared to Growth
Tax History
| Year | Tax Paid | Tax Assessment Tax Assessment Total Assessment is a certain percentage of the fair market value that is determined by local assessors to be the total taxable value of land and additions on the property. | Land | Improvement |
|---|---|---|---|---|
| 2025 | $16,824 | $241,900 | $96,400 | $145,500 |
| 2024 | $16,261 | $241,900 | $96,400 | $145,500 |
| 2023 | $16,261 | $241,900 | $96,400 | $145,500 |
| 2022 | $15,411 | $241,900 | $96,400 | $145,500 |
| 2021 | $11,227 | $241,900 | $96,400 | $145,500 |
| 2020 | $14,860 | $241,900 | $96,400 | $145,500 |
| 2019 | $14,422 | $241,900 | $96,400 | $145,500 |
| 2018 | $14,369 | $241,900 | $96,400 | $145,500 |
| 2017 | $14,323 | $241,900 | $96,400 | $145,500 |
| 2016 | $13,958 | $241,900 | $96,400 | $145,500 |
| 2015 | $13,648 | $241,900 | $96,400 | $145,500 |
| 2014 | $13,307 | $241,900 | $96,400 | $145,500 |
Source: Public Records
Map
Nearby Homes