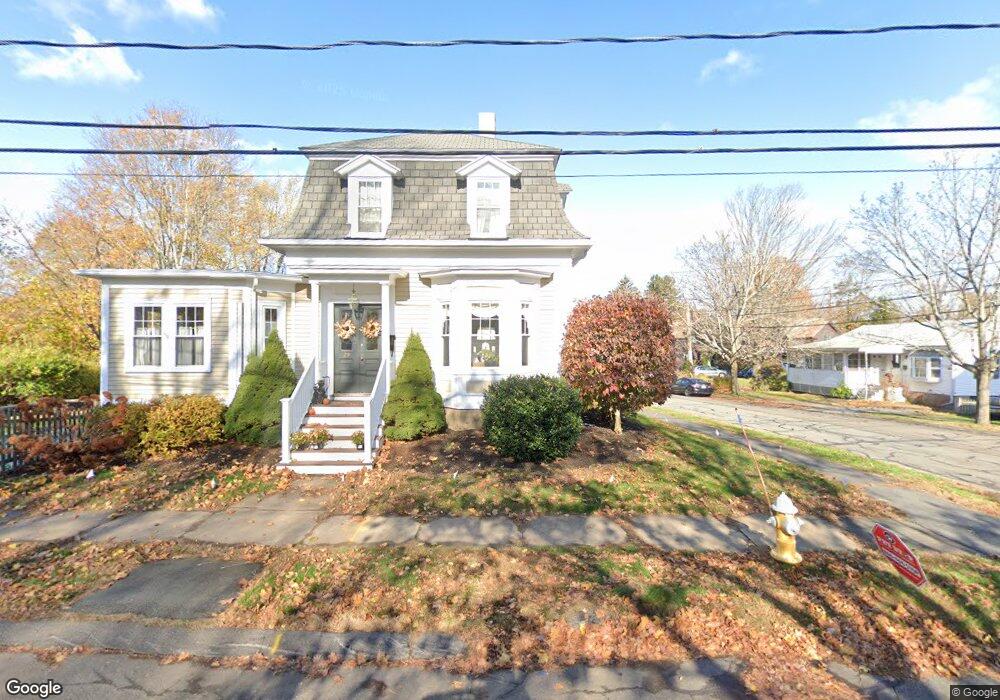
29 Braman St Danvers, MA 01923
Estimated Value: $773,810 - $900,000
3
Beds
2
Baths
2,166
Sq Ft
$374/Sq Ft
Est. Value
About This Home
This home is located at 29 Braman St, Danvers, MA 01923 and is currently estimated at $809,953, approximately $373 per square foot. 29 Braman St is a home located in Essex County with nearby schools including Danvers High School, St. Mary of the Annunciation School, and St. John's Prep.
Ownership History
Date
Name
Owned For
Owner Type
Purchase Details
Closed on
Sep 9, 2016
Sold by
Tinney Christina B
Bought by
C Bouras Tinney Ret and Bouras-Tinney
Current Estimated Value
Purchase Details
Closed on
Sep 14, 2007
Sold by
Brewer Laura M and Brewer Todd A
Bought by
Tinney Christina B
Purchase Details
Closed on
Jul 17, 2002
Sold by
Walo Douglas M and Walo Patricia M
Bought by
Brewer Todd A and Brewer Laura M
Create a Home Valuation Report for This Property
The Home Valuation Report is an in-depth analysis detailing your home's value as well as a comparison with similar homes in the area
Home Values in the Area
Average Home Value in this Area
Purchase History
| Date | Buyer | Sale Price | Title Company |
|---|---|---|---|
| C Bouras Tinney Ret | -- | -- | |
| Tinney Christina B | $426,000 | -- | |
| Brewer Todd A | $436,000 | -- |
Source: Public Records
Mortgage History
| Date | Status | Borrower | Loan Amount |
|---|---|---|---|
| Previous Owner | Brewer Todd A | $172,500 |
Source: Public Records
Tax History
| Year | Tax Paid | Tax Assessment Tax Assessment Total Assessment is a certain percentage of the fair market value that is determined by local assessors to be the total taxable value of land and additions on the property. | Land | Improvement |
|---|---|---|---|---|
| 2025 | $7,374 | $671,000 | $348,200 | $322,800 |
| 2024 | $7,230 | $650,800 | $336,200 | $314,600 |
| 2023 | $6,828 | $581,100 | $303,800 | $277,300 |
| 2022 | $6,731 | $531,700 | $276,200 | $255,500 |
| 2021 | $6,472 | $484,800 | $263,000 | $221,800 |
| 2020 | $6,407 | $490,600 | $263,000 | $227,600 |
| 2019 | $6,133 | $461,800 | $228,200 | $233,600 |
| 2018 | $5,832 | $430,700 | $228,200 | $202,500 |
| 2017 | $5,710 | $402,400 | $207,800 | $194,600 |
| 2016 | $5,493 | $386,800 | $198,200 | $188,600 |
| 2015 | $5,232 | $350,900 | $174,200 | $176,700 |
Source: Public Records
Map
Nearby Homes
- 10 Clark St
- 14 Williams St Unit C17
- 43 Hobart St Unit B
- 63 Adams St
- 22 Collins St Unit 31
- 5 Holten St
- 97 Sylvan St Unit 7
- 6 Venice St Unit B3
- 22 Maple Ave
- 35 High St Unit 3D
- 20 Central Ave
- 35 Locust St Unit 3
- 11 Andover St
- 108 Abington Rd Unit 108
- 14 Chase St
- 11 Riverside Ave Unit 111
- 102 Centre St
- 34 Bayview Terrace Unit 5
- 2 Chapel Rd
- 7 Riverbank Ave Unit 7
Your Personal Tour Guide
Ask me questions while you tour the home.