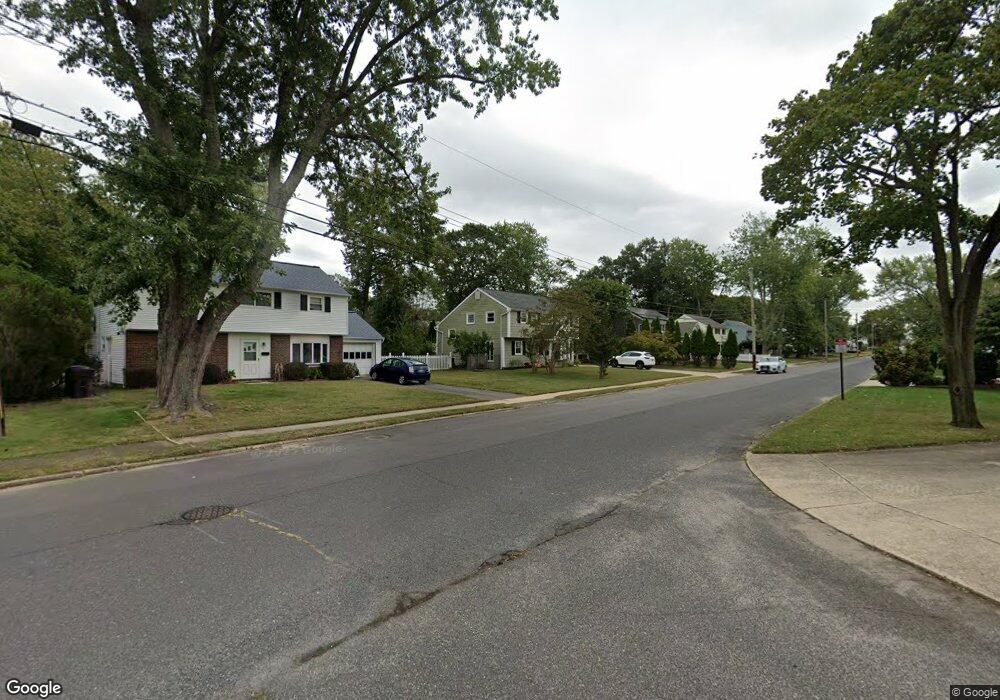
29 Branch Rd Oakhurst, NJ 07755
Estimated Value: $784,433 - $892,000
3
Beds
2
Baths
1,470
Sq Ft
$570/Sq Ft
Est. Value
About This Home
This home is located at 29 Branch Rd, Oakhurst, NJ 07755 and is currently estimated at $838,358, approximately $570 per square foot. 29 Branch Rd is a home located in Monmouth County with nearby schools including Ocean Township High School, Bet Yaakov of the Jersey Shore, and Ma'or Yeshiva High School for Boys.
Ownership History
Date
Name
Owned For
Owner Type
Purchase Details
Closed on
Mar 31, 1999
Sold by
King John
Bought by
Holman David and Holman Michelle
Current Estimated Value
Home Financials for this Owner
Home Financials are based on the most recent Mortgage that was taken out on this home.
Original Mortgage
$126,000
Interest Rate
6.88%
Purchase Details
Closed on
Sep 25, 1997
Sold by
Mcallister Sun Cha
Bought by
King John
Home Financials for this Owner
Home Financials are based on the most recent Mortgage that was taken out on this home.
Original Mortgage
$126,000
Interest Rate
7.46%
Create a Home Valuation Report for This Property
The Home Valuation Report is an in-depth analysis detailing your home's value as well as a comparison with similar homes in the area
Home Values in the Area
Average Home Value in this Area
Purchase History
| Date | Buyer | Sale Price | Title Company |
|---|---|---|---|
| Holman David | $167,500 | -- | |
| King John | $140,000 | -- |
Source: Public Records
Mortgage History
| Date | Status | Borrower | Loan Amount |
|---|---|---|---|
| Previous Owner | Holman David | $126,000 | |
| Previous Owner | King John | $126,000 |
Source: Public Records
Tax History
| Year | Tax Paid | Tax Assessment Tax Assessment Total Assessment is a certain percentage of the fair market value that is determined by local assessors to be the total taxable value of land and additions on the property. | Land | Improvement |
|---|---|---|---|---|
| 2025 | $9,673 | $758,800 | $606,500 | $152,300 |
| 2024 | $10,309 | $678,300 | $529,500 | $148,800 |
| 2023 | $10,309 | $674,200 | $529,500 | $144,700 |
| 2022 | $7,392 | $497,200 | $359,500 | $137,700 |
| 2021 | $7,392 | $377,100 | $257,000 | $120,100 |
| 2020 | $7,454 | $374,400 | $257,000 | $117,400 |
| 2019 | $7,518 | $368,700 | $252,000 | $116,700 |
| 2018 | $7,272 | $347,300 | $237,000 | $110,300 |
| 2017 | $6,439 | $306,200 | $202,000 | $104,200 |
| 2016 | $6,242 | $267,000 | $157,000 | $110,000 |
| 2015 | $6,329 | $274,100 | $167,000 | $107,100 |
| 2014 | $6,640 | $291,500 | $192,000 | $99,500 |
Source: Public Records
Map
Nearby Homes
Your Personal Tour Guide
Ask me questions while you tour the home.