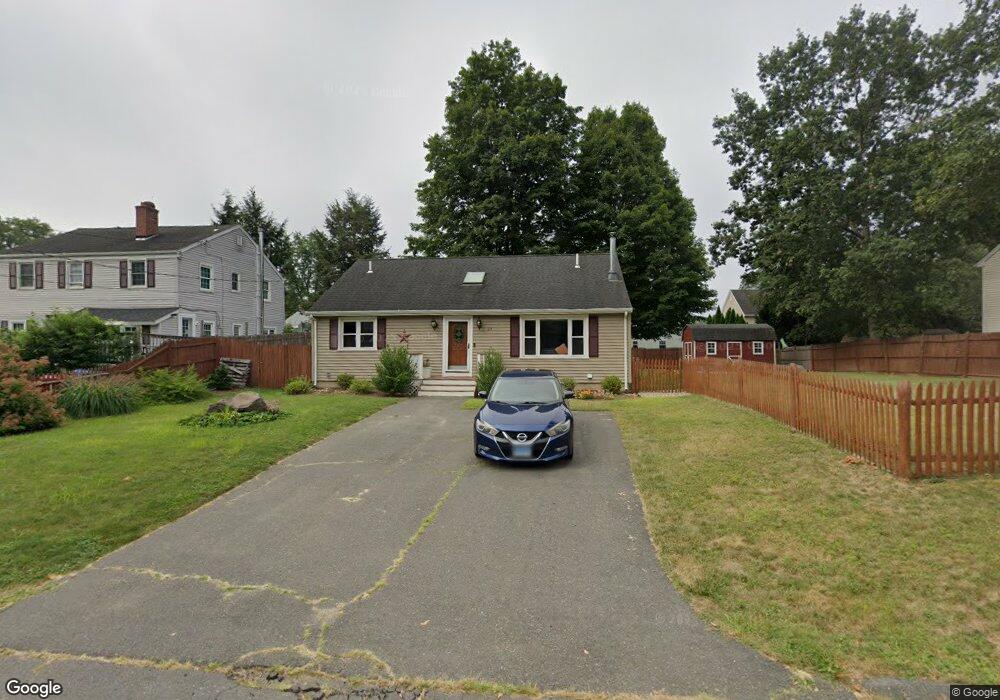
29 Buena Vista Dr Unit ST Unionville, CT 06085
Estimated Value: $402,000 - $451,306
3
Beds
2
Baths
1,200
Sq Ft
$358/Sq Ft
Est. Value
About This Home
This home is located at 29 Buena Vista Dr Unit ST, Unionville, CT 06085 and is currently estimated at $429,827, approximately $358 per square foot. 29 Buena Vista Dr Unit ST is a home located in Hartford County with nearby schools including West Woods Upper Elementary School, Irving A. Robbins Middle School, and Farmington High School.
Ownership History
Date
Name
Owned For
Owner Type
Purchase Details
Closed on
Jul 19, 2024
Sold by
Lynch Heather L
Bought by
Olson Jacob and Olson Jenni
Current Estimated Value
Home Financials for this Owner
Home Financials are based on the most recent Mortgage that was taken out on this home.
Original Mortgage
$295,000
Outstanding Balance
$291,449
Interest Rate
6.95%
Mortgage Type
Purchase Money Mortgage
Estimated Equity
$138,378
Purchase Details
Closed on
Oct 7, 2013
Sold by
Graffagnino Matthew
Bought by
Lynch Heather L
Purchase Details
Closed on
Aug 12, 2013
Sold by
Joseph Manzella T and Joseph Manzella
Bought by
Graffagnino Matthew
Create a Home Valuation Report for This Property
The Home Valuation Report is an in-depth analysis detailing your home's value as well as a comparison with similar homes in the area
Home Values in the Area
Average Home Value in this Area
Purchase History
| Date | Buyer | Sale Price | Title Company |
|---|---|---|---|
| Olson Jacob | $395,000 | None Available | |
| Olson Jacob | $395,000 | None Available | |
| Lynch Heather L | $207,000 | -- | |
| Graffagnino Matthew | -- | -- | |
| Lynch Heather L | $207,000 | -- | |
| Graffagnino Matthew | -- | -- |
Source: Public Records
Mortgage History
| Date | Status | Borrower | Loan Amount |
|---|---|---|---|
| Open | Olson Jacob | $295,000 | |
| Closed | Olson Jacob | $295,000 | |
| Previous Owner | Graffagnino Matthew | $41,500 | |
| Previous Owner | Graffagnino Matthew | $56,000 |
Source: Public Records
Tax History Compared to Growth
Tax History
| Year | Tax Paid | Tax Assessment Tax Assessment Total Assessment is a certain percentage of the fair market value that is determined by local assessors to be the total taxable value of land and additions on the property. | Land | Improvement |
|---|---|---|---|---|
| 2025 | $6,062 | $227,710 | $75,110 | $152,600 |
| 2024 | $5,569 | $218,820 | $75,110 | $143,710 |
| 2023 | $5,298 | $218,820 | $75,110 | $143,710 |
| 2022 | $4,712 | $160,710 | $68,290 | $92,420 |
| 2021 | $4,630 | $160,710 | $68,290 | $92,420 |
| 2020 | $4,495 | $160,710 | $68,290 | $92,420 |
| 2019 | $4,495 | $160,710 | $68,290 | $92,420 |
| 2018 | $4,368 | $160,710 | $68,290 | $92,420 |
| 2017 | $3,918 | $146,870 | $66,370 | $80,500 |
| 2016 | $3,657 | $141,860 | $66,370 | $75,490 |
| 2015 | $3,548 | $141,860 | $66,370 | $75,490 |
| 2014 | $3,467 | $141,850 | $66,360 | $75,490 |
Source: Public Records
Map
Nearby Homes
- 61 Litchfield Rd
- 69 Lake Garda Dr
- 50 E Shore Blvd
- 17 Pine Dr
- 487 Plainville Ave
- 6 Burlington Rd
- 16 Strong St
- 10 Woodside Dr
- 7 Newcastle Place
- 27 Westview Terrace
- 86 Alpine Dr
- 55 Depot Place
- 220 Monce Rd Unit 17
- 31 Railroad Ave
- 148 River Rd
- 54 Westview Terrace
- 8919 Taine Mountain Rd
- 243 New Britain Ave Unit 243
- 267 New Britain Ave
- 20 Farm Dr
- 29 Buena Vista Dr
- 33 Buena Vista Dr
- 27 Buena Vista Dr
- 18 Lincoln St
- 16 Lincoln St
- 20 Lincoln St
- 35 Buena Vista Dr
- 35 Buena Vista Dr Unit DR
- 25 Buena Vista Dr
- 14 Lincoln St
- 26 Buena Vista Dr
- 34 Buena Vista Dr
- 34 Buena Vista Dr Unit DR
- 12 Lincoln St
- 23 Buena Vista Dr
- 24 Lincoln St
- 3 Birch St
- 10 Lincoln St
- 24 Buena Vista Dr
- 17 Lincoln St