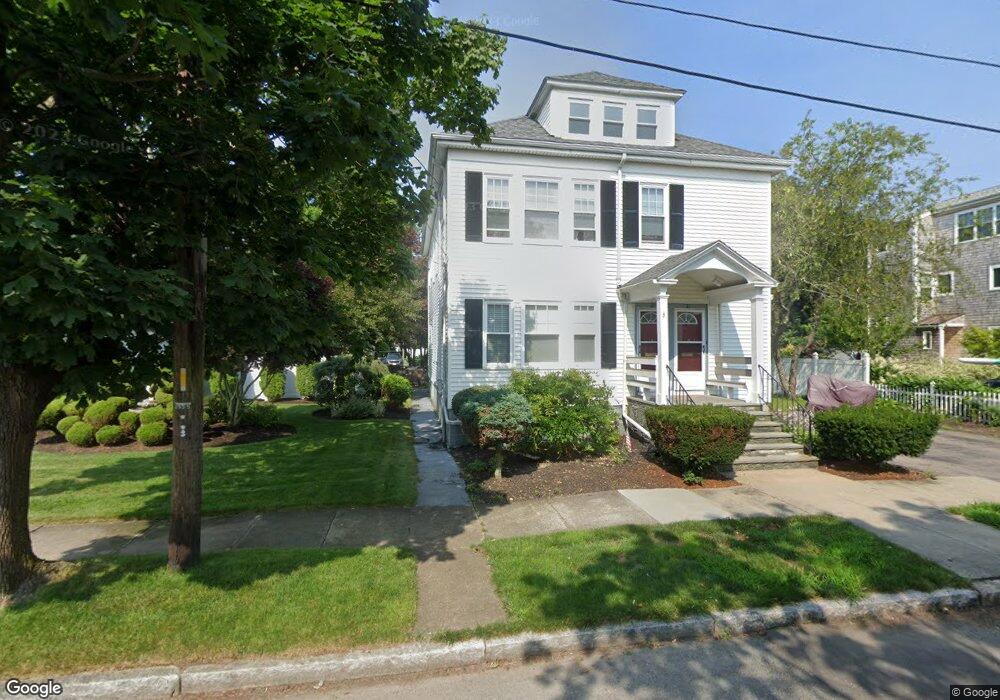
29 Byron St Unit 31 New Bedford, MA 02740
Buttonwood Park NeighborhoodEstimated Value: $517,000 - $708,000
4
Beds
2
Baths
2,690
Sq Ft
$218/Sq Ft
Est. Value
About This Home
This home is located at 29 Byron St Unit 31, New Bedford, MA 02740 and is currently estimated at $586,973, approximately $218 per square foot. 29 Byron St Unit 31 is a home located in Bristol County with nearby schools including Betsey B. Winslow Elementary School, Keith Middle School, and New Bedford High School.
Ownership History
Date
Name
Owned For
Owner Type
Purchase Details
Closed on
May 30, 2025
Sold by
Desena Jevon K
Bought by
Desena Jevon K and Desena John
Current Estimated Value
Purchase Details
Closed on
Nov 10, 1997
Sold by
Macedo Paul T
Bought by
Desena Jevon K
Home Financials for this Owner
Home Financials are based on the most recent Mortgage that was taken out on this home.
Original Mortgage
$106,400
Interest Rate
7.19%
Mortgage Type
Purchase Money Mortgage
Purchase Details
Closed on
Aug 30, 1991
Sold by
Murray William M
Bought by
Macedo Paul T
Purchase Details
Closed on
May 1, 1991
Sold by
M G Rlty Inc
Bought by
Braga Elias A and Braga Susan L
Create a Home Valuation Report for This Property
The Home Valuation Report is an in-depth analysis detailing your home's value as well as a comparison with similar homes in the area
Home Values in the Area
Average Home Value in this Area
Purchase History
| Date | Buyer | Sale Price | Title Company |
|---|---|---|---|
| Desena Jevon K | -- | -- | |
| Desena Jevon K | -- | -- | |
| Desena Jevon K | -- | -- | |
| Desena Jevon K | -- | -- | |
| Desena Jevon K | -- | -- | |
| Desena Jevon K | -- | -- | |
| Desena Jevon K | $133,000 | -- | |
| Desena Jevon K | $133,000 | -- | |
| Macedo Paul T | $123,000 | -- | |
| Braga Elias A | $102,500 | -- | |
| Braga Elias A | $102,500 | -- |
Source: Public Records
Mortgage History
| Date | Status | Borrower | Loan Amount |
|---|---|---|---|
| Previous Owner | Braga Elias A | $101,000 | |
| Previous Owner | Braga Elias A | $106,400 |
Source: Public Records
Tax History Compared to Growth
Tax History
| Year | Tax Paid | Tax Assessment Tax Assessment Total Assessment is a certain percentage of the fair market value that is determined by local assessors to be the total taxable value of land and additions on the property. | Land | Improvement |
|---|---|---|---|---|
| 2025 | $5,812 | $513,900 | $113,500 | $400,400 |
| 2024 | $5,242 | $436,800 | $108,200 | $328,600 |
| 2023 | $5,104 | $357,200 | $96,800 | $260,400 |
| 2022 | $4,653 | $299,400 | $92,200 | $207,200 |
| 2021 | $4,668 | $299,400 | $92,200 | $207,200 |
| 2020 | $4,557 | $282,000 | $95,800 | $186,200 |
| 2019 | $4,483 | $272,200 | $97,500 | $174,700 |
| 2018 | $4,212 | $253,300 | $97,500 | $155,800 |
| 2017 | $3,814 | $228,500 | $97,500 | $131,000 |
| 2016 | $3,585 | $217,400 | $92,200 | $125,200 |
| 2015 | $3,404 | $216,400 | $95,800 | $120,600 |
| 2014 | $3,315 | $218,700 | $97,500 | $121,200 |
Source: Public Records
Map
Nearby Homes