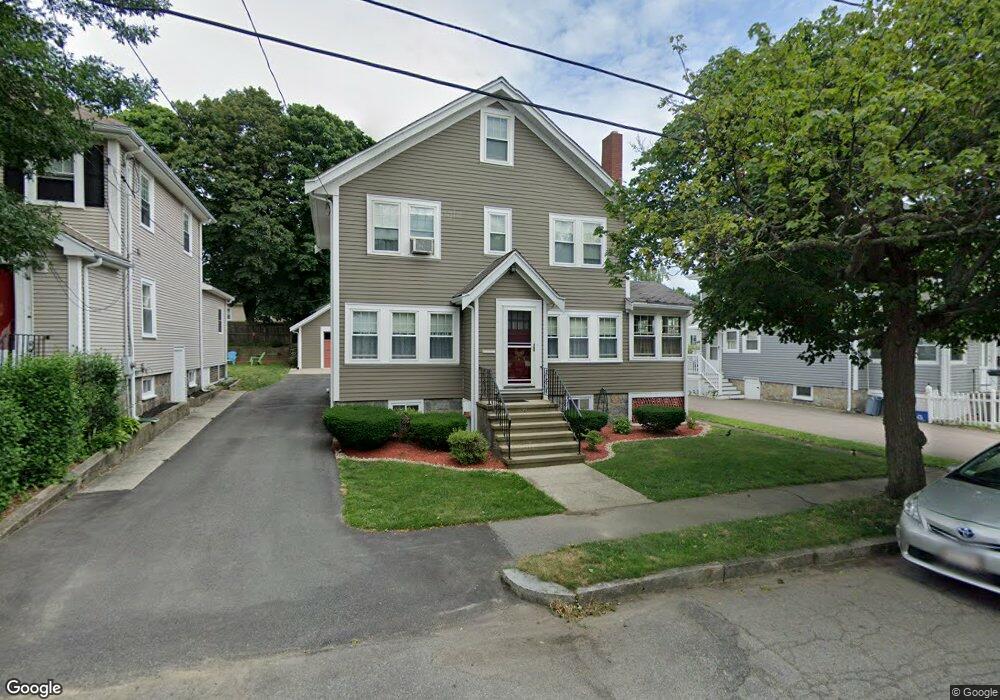
29 Charlesmount Ave Quincy, MA 02169
Quincy Point NeighborhoodEstimated Value: $649,000 - $810,000
About This Home
This home is located at 29 Charlesmount Ave, Quincy, MA 02169 and is currently estimated at $714,269, approximately $420 per square foot. 29 Charlesmount Ave is a home located in Norfolk County with nearby schools including Point Webster Middle School, Clifford H. Marshall Elementary School, and Quincy High School.
Ownership History
We collect this data history from publicly available records. To have your information removed, we recommend requesting removal directly through your county’s website.
Purchase Details
Home Financials for this Owner
Home Financials are based on the most recent Mortgage that was taken out on this home.Home Values in the Area
Average Home Value in this Area
Purchase History
We collect this data history from publicly available records. To have your information removed, we recommend requesting removal directly through your county’s website.
| Date | Buyer | Sale Price | Title Company |
|---|---|---|---|
| $135,000 | -- |
Mortgage History
We collect this data history from publicly available records. To have your information removed, we recommend requesting removal directly through your county’s website.
| Date | Status | Borrower | Loan Amount |
|---|---|---|---|
| Open | $85,000 |
Tax History
We collect this data history from publicly available records. To have your information removed, we recommend requesting removal directly through your county’s website.
| Year | Tax Paid | Tax Assessment Tax Assessment Total Assessment is a certain percentage of the fair market value that is determined by local assessors to be the total taxable value of land and additions on the property. | Land | Improvement |
|---|---|---|---|---|
| 2025 | $6,446 | $559,100 | $268,700 | $290,400 |
| 2024 | $6,300 | $559,000 | $255,900 | $303,100 |
| 2023 | $5,732 | $515,000 | $232,600 | $282,400 |
| 2022 | $5,677 | $473,900 | $211,500 | $262,400 |
| 2021 | $5,638 | $464,400 | $211,500 | $252,900 |
| 2020 | $5,370 | $432,000 | $199,500 | $232,500 |
| 2019 | $5,104 | $406,700 | $184,700 | $222,000 |
| 2018 | $4,985 | $373,700 | $167,900 | $205,800 |
| 2017 | $4,651 | $328,200 | $159,900 | $168,300 |
| 2016 | $4,347 | $302,700 | $145,400 | $157,300 |
| 2015 | $4,114 | $281,800 | $137,100 | $144,700 |
| 2014 | $3,803 | $255,900 | $137,100 | $118,800 |
Map
- 284 Quincy Ave
- 19 Keyes St
- 200 Falls Blvd Unit A105
- 200 Falls Blvd Unit B208
- 200 Falls Blvd Unit F307
- 168 Main St
- 28 Arnold St
- 45 Sumner St
- 20-22 Cyril St
- 99 Sumner St Unit B
- 99 Sumner St Unit A
- 101 Sumner St Unit B
- 101 Sumner St Unit A
- 96 South St
- 13-21 Des Moines Rd
- 153 Sumner St Unit 1
- 62 South St Unit 1A
- 62 South St Unit 15
- 161 Sumner St Unit 2
- 35 Desmoines Rd Unit 503
- 40 Burns Ave
- 44 Burns Ave
- 36 Burns Ave
- 33 Charlesmount Ave Unit 1
- 33 Charlesmount Ave
- 32 Burns Ave
- 37 Charlesmount Ave
- 48 Burns Ave
- 41 Charlesmount Ave
- 25 Charlesmount Ave
- 28 Burns Ave
- 56 Burns Ave
- 39 Burns Ave
- 21 Charlesmount Ave
- 43 Burns Ave
- 45 Charlesmount Ave
- 35 Burns Ave
- 24 Burns Ave
- 47 Burns Ave
- 31 Burns Ave
Ask me questions while you tour the home.