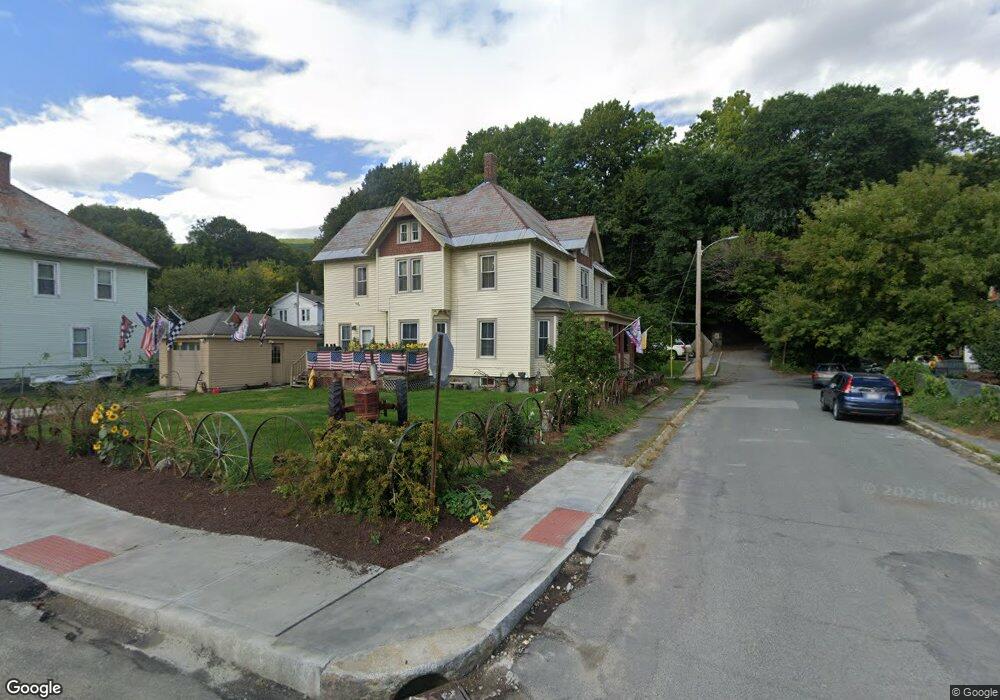
29 Chase Ave Unit 31 North Adams, MA 01247
Estimated Value: $240,000 - $320,000
6
Beds
4
Baths
3,719
Sq Ft
$73/Sq Ft
Est. Value
About This Home
This home is located at 29 Chase Ave Unit 31, North Adams, MA 01247 and is currently estimated at $271,094, approximately $72 per square foot. 29 Chase Ave Unit 31 is a home located in Berkshire County with nearby schools including Greylock Elementary School and Drury High School.
Ownership History
Date
Name
Owned For
Owner Type
Purchase Details
Closed on
Jul 14, 2004
Sold by
Hsg Opportunities In
Bought by
Bishop Max A and Ellis Donna L
Current Estimated Value
Home Financials for this Owner
Home Financials are based on the most recent Mortgage that was taken out on this home.
Original Mortgage
$119,560
Outstanding Balance
$58,996
Interest Rate
6.25%
Mortgage Type
Purchase Money Mortgage
Estimated Equity
$212,098
Purchase Details
Closed on
Aug 1, 2000
Sold by
Housing Oppor Inc
Bought by
Harrington J Richard W J and Harrington Lisa L
Purchase Details
Closed on
Mar 30, 1999
Sold by
Department Of Housing & Urban Dev
Bought by
Housing Opportunities
Purchase Details
Closed on
Jan 7, 1999
Sold by
Ellsworth Barbara and Midfirst Bk
Bought by
Housing & Urban Dev
Purchase Details
Closed on
Mar 31, 1989
Sold by
Baben Debra
Bought by
Ellsworth Barbara J
Create a Home Valuation Report for This Property
The Home Valuation Report is an in-depth analysis detailing your home's value as well as a comparison with similar homes in the area
Home Values in the Area
Average Home Value in this Area
Purchase History
| Date | Buyer | Sale Price | Title Company |
|---|---|---|---|
| Bishop Max A | $122,000 | -- | |
| Bishop Max A | $122,000 | -- | |
| Harrington J Richard W J | $122,000 | -- | |
| Harrington J Richard W J | $122,000 | -- | |
| Housing Opportunities | $2,857 | -- | |
| Housing Opportunities | $2,857 | -- | |
| Housing & Urban Dev | $94,783 | -- | |
| Housing & Urban Dev | $94,783 | -- | |
| Ellsworth Barbara J | $75,000 | -- | |
| Ellsworth Barbara J | $75,000 | -- |
Source: Public Records
Mortgage History
| Date | Status | Borrower | Loan Amount |
|---|---|---|---|
| Open | Ellsworth Barbara J | $119,560 | |
| Closed | Ellsworth Barbara J | $119,560 |
Source: Public Records
Tax History Compared to Growth
Tax History
| Year | Tax Paid | Tax Assessment Tax Assessment Total Assessment is a certain percentage of the fair market value that is determined by local assessors to be the total taxable value of land and additions on the property. | Land | Improvement |
|---|---|---|---|---|
| 2025 | $3,431 | $205,300 | $23,000 | $182,300 |
| 2024 | $3,500 | $204,200 | $21,000 | $183,200 |
| 2023 | $3,219 | $182,200 | $21,000 | $161,200 |
| 2022 | $3,126 | $168,700 | $21,000 | $147,700 |
| 2021 | $2,907 | $156,200 | $19,500 | $136,700 |
| 2020 | $2,899 | $155,700 | $19,800 | $135,900 |
| 2019 | $3,004 | $157,200 | $20,200 | $137,000 |
| 2018 | $2,948 | $160,400 | $21,700 | $138,700 |
| 2017 | $2,804 | $158,700 | $21,500 | $137,200 |
| 2016 | $2,762 | $158,800 | $21,500 | $137,300 |
| 2015 | $2,662 | $159,500 | $22,200 | $137,300 |
Source: Public Records
Map
Nearby Homes
- 62-64 Chase Ave
- 166 Houghton St
- 0 River St
- 66-68 Bracewell Ave
- 33-35 Hall St
- 159 Eagle St
- 50 1/2 Williams St
- 19 N Church St Unit 11
- 19 N Church St Unit 14
- 19 N Church St Unit 12
- 19 N Church St Unit 7
- 84 W Main St
- 86 W Main St
- 24 Franklin St
- 41 Prospect St
- 35 Jackson St
- 20 Wesleyan St
- 0 Church St
- 33 Hudson St
- 16 Forrest St
- 35 Chase Ave
- 169-171 Bracewell Ave
- 169 Bracewell Ave Unit 171
- 7 Brook Terrace
- 26 Chase Ave Unit 28
- 175 Bracewell Ave Unit 177
- 36 Chase Ave
- 13 Brook Terrace
- 1 Brook Terrace
- 170 Bracewell Ave Unit 172
- 40 Chase Ave
- 160 Houghton St
- 1 Chase Hill
- 50 Chase Ave Unit 52
- 50 Chase Ave
- 18 Chase Ave
- 143 Bracewell Ave
- 143 Bracewell Ave
- 164 Houghton St Unit 166
- 166 Houghton St