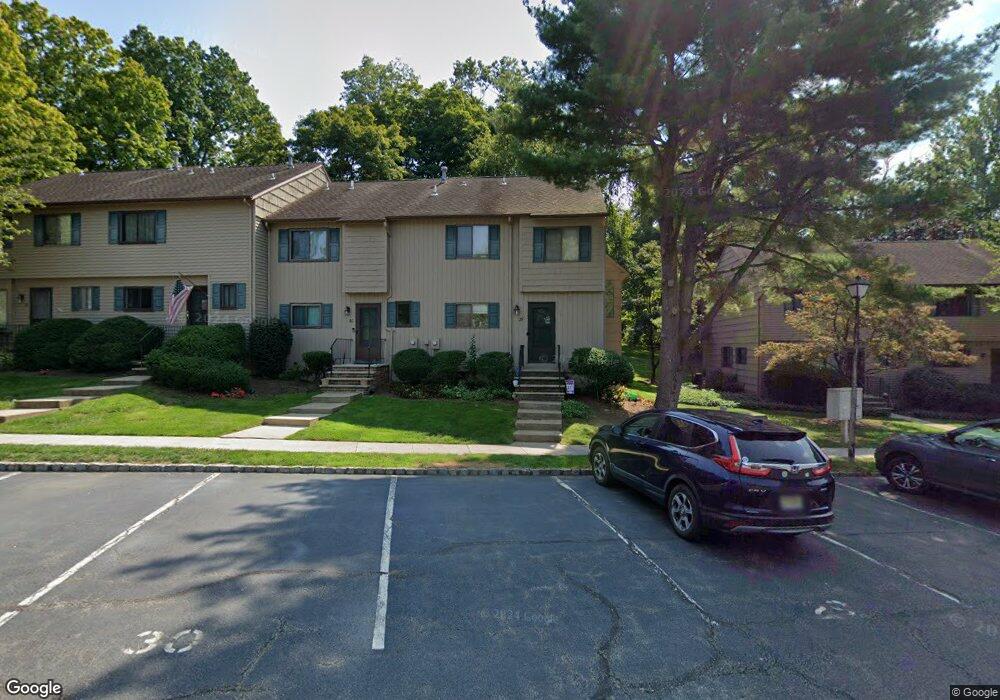
29 Chestnut Ct High Bridge, NJ 08829
Estimated Value: $296,000 - $316,000
Studio
--
Bath
1,317
Sq Ft
$234/Sq Ft
Est. Value
About This Home
This home is located at 29 Chestnut Ct, High Bridge, NJ 08829 and is currently estimated at $308,480, approximately $234 per square foot. 29 Chestnut Ct is a home located in Hunterdon County with nearby schools including High Bridge Elementary School, High Bridge Middle School, and Voorhees High School.
Ownership History
Date
Name
Owned For
Owner Type
Purchase Details
Closed on
Sep 3, 2019
Sold by
Besold Eric and Estate Of Joanne Elizabeth Bes
Bought by
Besold Eric
Current Estimated Value
Purchase Details
Closed on
Aug 2, 2019
Sold by
Besold Eric and Estate Of Joawnne Elizabeth Be
Bought by
Besold Eric
Purchase Details
Closed on
Dec 5, 1995
Sold by
Skop Andrew J and Skop Wendy J
Bought by
Besold Jo Anne
Purchase Details
Closed on
Jan 27, 1992
Sold by
Layman Earl L and Lynn Ann
Bought by
Skop Andrew J and Skop Wendy J
Create a Home Valuation Report for This Property
The Home Valuation Report is an in-depth analysis detailing your home's value as well as a comparison with similar homes in the area
Home Values in the Area
Average Home Value in this Area
Purchase History
| Date | Buyer | Sale Price | Title Company |
|---|---|---|---|
| Besold Eric | -- | None Available | |
| Besold Eric | -- | None Available | |
| Besold Jo Anne | $107,000 | -- | |
| Skop Andrew J | $104,300 | -- |
Source: Public Records
Tax History
| Year | Tax Paid | Tax Assessment Tax Assessment Total Assessment is a certain percentage of the fair market value that is determined by local assessors to be the total taxable value of land and additions on the property. | Land | Improvement |
|---|---|---|---|---|
| 2025 | $7,589 | $221,700 | $116,300 | $105,400 |
| 2024 | $7,315 | $232,500 | $71,900 | $160,600 |
Source: Public Records
Map
Nearby Homes
Your Personal Tour Guide
Ask me questions while you tour the home.