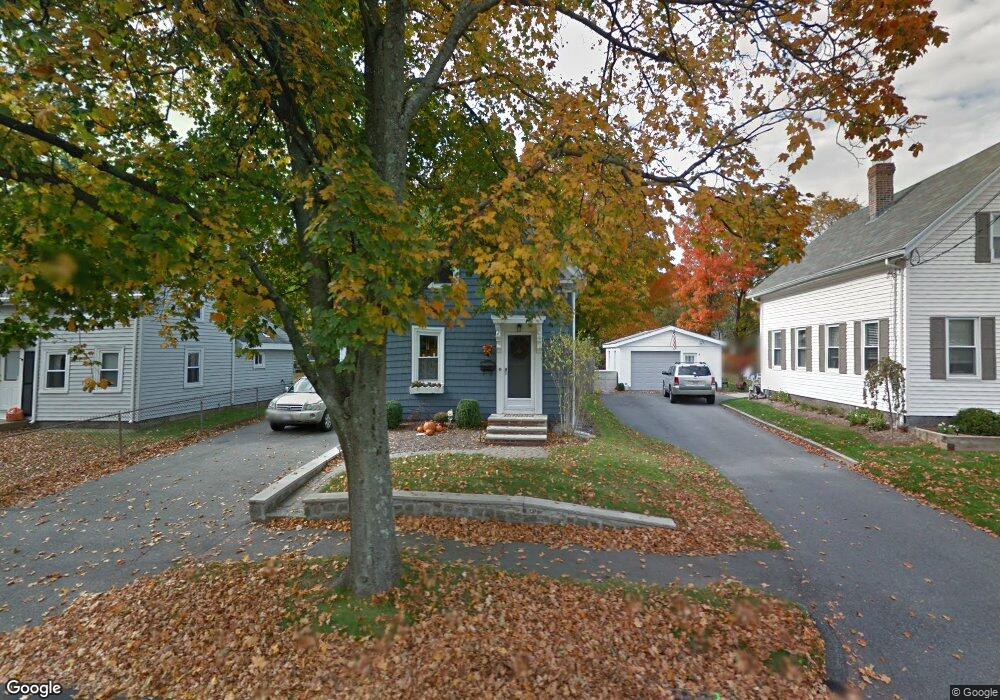
29 Chestnut St Danvers, MA 01923
Estimated Value: $631,145 - $697,000
3
Beds
3
Baths
1,080
Sq Ft
$603/Sq Ft
Est. Value
About This Home
This home is located at 29 Chestnut St, Danvers, MA 01923 and is currently estimated at $650,786, approximately $602 per square foot. 29 Chestnut St is a home located in Essex County with nearby schools including Danvers High School, St. Mary of the Annunciation School, and St. John's Prep.
Ownership History
Date
Name
Owned For
Owner Type
Purchase Details
Closed on
Mar 25, 2020
Sold by
Newton Richard C
Bought by
29 Chestnut Rt
Current Estimated Value
Purchase Details
Closed on
Oct 7, 2014
Sold by
9 Rt
Bought by
Newton Richard C
Purchase Details
Closed on
Mar 14, 2008
Sold by
Smorczewski Lisa M
Bought by
Newton Tr Richard C
Purchase Details
Closed on
Aug 31, 1995
Sold by
Hatcher John E
Bought by
Smorczewski Richard and Smorczewski Lisa
Purchase Details
Closed on
Jan 22, 1992
Sold by
Dwinell Edythe
Bought by
Hatcher John E
Create a Home Valuation Report for This Property
The Home Valuation Report is an in-depth analysis detailing your home's value as well as a comparison with similar homes in the area
Home Values in the Area
Average Home Value in this Area
Purchase History
| Date | Buyer | Sale Price | Title Company |
|---|---|---|---|
| 29 Chestnut Rt | -- | None Available | |
| Newton Richard C | -- | -- | |
| Newton Tr Richard C | -- | -- | |
| Smorczewski Richard | $156,500 | -- | |
| Hatcher John E | $122,000 | -- |
Source: Public Records
Mortgage History
| Date | Status | Borrower | Loan Amount |
|---|---|---|---|
| Previous Owner | Hatcher John E | $200,000 | |
| Previous Owner | Hatcher John E | $31,200 | |
| Previous Owner | Hatcher John E | $100,000 |
Source: Public Records
Tax History
| Year | Tax Paid | Tax Assessment Tax Assessment Total Assessment is a certain percentage of the fair market value that is determined by local assessors to be the total taxable value of land and additions on the property. | Land | Improvement |
|---|---|---|---|---|
| 2025 | $5,891 | $536,000 | $335,000 | $201,000 |
| 2024 | $5,742 | $516,800 | $323,400 | $193,400 |
| 2023 | $5,420 | $461,300 | $292,200 | $169,100 |
| 2022 | $5,343 | $422,000 | $265,700 | $156,300 |
| 2021 | $5,200 | $389,500 | $252,900 | $136,600 |
| 2020 | $5,087 | $389,500 | $252,900 | $136,600 |
| 2019 | $4,775 | $359,600 | $219,500 | $140,100 |
| 2018 | $4,624 | $341,500 | $219,500 | $122,000 |
| 2017 | $4,500 | $317,100 | $199,800 | $117,300 |
| 2016 | $4,322 | $304,400 | $190,600 | $113,800 |
| 2015 | -- | $272,200 | $167,500 | $104,700 |
Source: Public Records
Map
Nearby Homes
- 35 Locust St Unit 3
- 4 Butler Ave
- 20 Central Ave
- 12 Central Ave Unit 1
- 42 Coolidge Rd
- 6 Venice St Unit B3
- 35 High St Unit 3D
- 14 Williams St Unit C17
- 12 Exeter St
- 7 Riverbank Ave Unit 7
- 7 Riverbank Ave
- 11 Riverside Ave Unit 111
- 35 Bayview Terrace Unit 7
- 63 Adams St
- 57 Adams St
- 108 Abington Rd Unit 108
- 147 High St
- 6 Colby Rd
- 198 Conant St
- 97 Sylvan St Unit 7