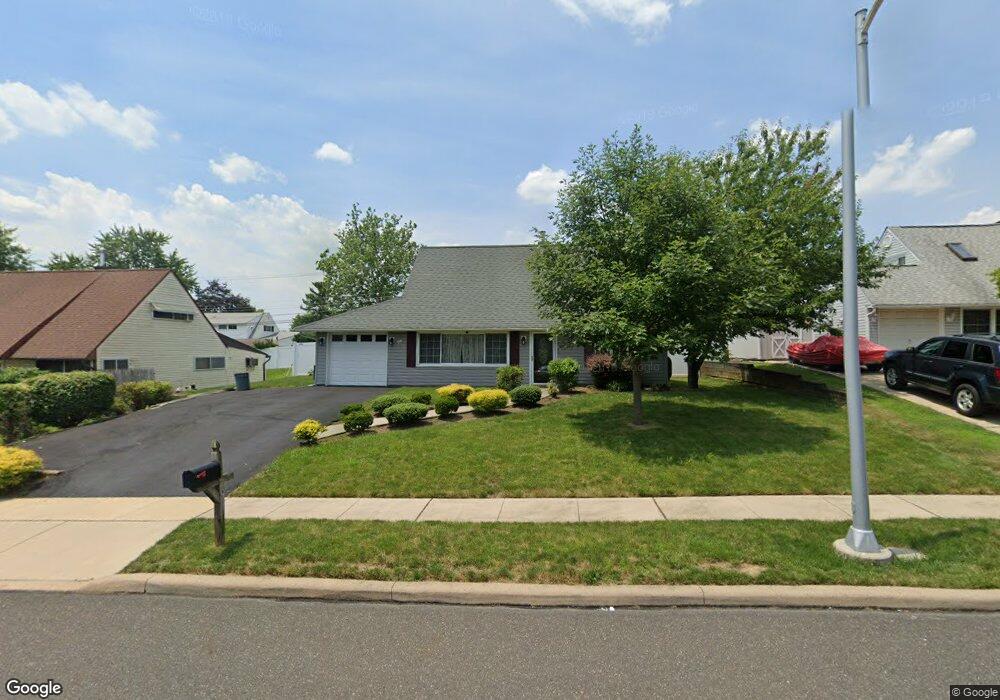
29 Cobalt Cross Rd Levittown, PA 19057
Estimated Value: $437,004 - $467,000
3
Beds
2
Baths
1,575
Sq Ft
$286/Sq Ft
Est. Value
About This Home
This home is located at 29 Cobalt Cross Rd, Levittown, PA 19057 and is currently estimated at $451,001, approximately $286 per square foot. 29 Cobalt Cross Rd is a home located in Bucks County with nearby schools including Walter Miller Elementary School, Sandburg Middle School, and Neshaminy High School.
Ownership History
Date
Name
Owned For
Owner Type
Purchase Details
Closed on
Jun 13, 2025
Sold by
Gulick Frank L
Bought by
Allen Craig
Current Estimated Value
Home Financials for this Owner
Home Financials are based on the most recent Mortgage that was taken out on this home.
Original Mortgage
$460,000
Outstanding Balance
$458,807
Interest Rate
6.76%
Mortgage Type
VA
Estimated Equity
-$7,806
Purchase Details
Closed on
Apr 25, 2007
Sold by
Gulick Frank and Gulick Diane C
Bought by
Gulick Frank L
Home Financials for this Owner
Home Financials are based on the most recent Mortgage that was taken out on this home.
Original Mortgage
$195,000
Interest Rate
6.17%
Mortgage Type
New Conventional
Purchase Details
Closed on
Feb 9, 1995
Sold by
Gallagher William
Bought by
Gallagher William and Gallagher Holly Anne
Home Financials for this Owner
Home Financials are based on the most recent Mortgage that was taken out on this home.
Original Mortgage
$41,000
Interest Rate
9.09%
Create a Home Valuation Report for This Property
The Home Valuation Report is an in-depth analysis detailing your home's value as well as a comparison with similar homes in the area
Home Values in the Area
Average Home Value in this Area
Purchase History
| Date | Buyer | Sale Price | Title Company |
|---|---|---|---|
| Allen Craig | $460,000 | Title Services | |
| Gulick Frank L | -- | Chicago Title Insurance Comp | |
| Gallagher William | -- | -- |
Source: Public Records
Mortgage History
| Date | Status | Borrower | Loan Amount |
|---|---|---|---|
| Open | Allen Craig | $460,000 | |
| Previous Owner | Gulick Frank L | $195,000 | |
| Previous Owner | Gallagher William | $41,000 |
Source: Public Records
Tax History Compared to Growth
Tax History
| Year | Tax Paid | Tax Assessment Tax Assessment Total Assessment is a certain percentage of the fair market value that is determined by local assessors to be the total taxable value of land and additions on the property. | Land | Improvement |
|---|---|---|---|---|
| 2025 | $4,267 | $19,600 | $3,720 | $15,880 |
| 2024 | $4,267 | $19,600 | $3,720 | $15,880 |
| 2023 | $4,199 | $19,600 | $3,720 | $15,880 |
| 2022 | $4,089 | $19,600 | $3,720 | $15,880 |
| 2021 | $4,089 | $19,600 | $3,720 | $15,880 |
| 2020 | $4,040 | $19,600 | $3,720 | $15,880 |
| 2019 | $3,950 | $19,600 | $3,720 | $15,880 |
| 2018 | $3,877 | $19,600 | $3,720 | $15,880 |
| 2017 | $3,778 | $19,600 | $3,720 | $15,880 |
| 2016 | $3,778 | $19,600 | $3,720 | $15,880 |
| 2015 | $3,968 | $19,600 | $3,720 | $15,880 |
| 2014 | $3,968 | $19,600 | $3,720 | $15,880 |
Source: Public Records
Map
Nearby Homes