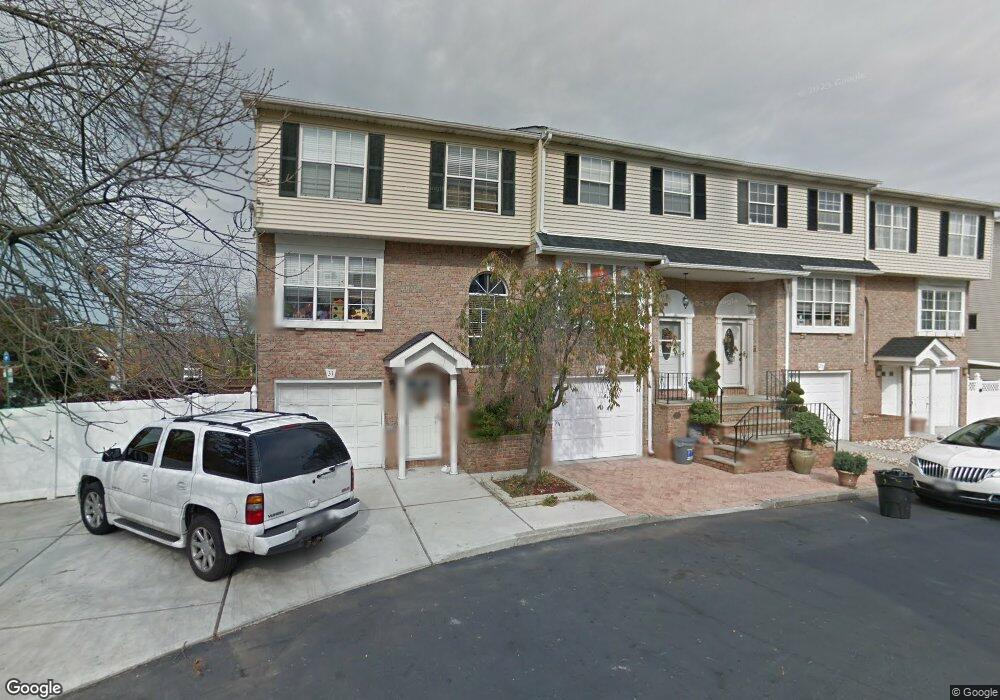
29 Coventry Loop Staten Island, NY 10312
Huguenot NeighborhoodEstimated Value: $589,008 - $623,000
2
Beds
3
Baths
1,262
Sq Ft
$482/Sq Ft
Est. Value
About This Home
This home is located at 29 Coventry Loop, Staten Island, NY 10312 and is currently estimated at $608,252, approximately $481 per square foot. 29 Coventry Loop is a home located in Richmond County with nearby schools including P.S. 4 - Maurice Wollin, I.S. 075 Frank D. Paulo, and Tottenville High School.
Ownership History
Date
Name
Owned For
Owner Type
Purchase Details
Closed on
Oct 22, 2009
Sold by
Rea Danielle and Rea Clementina
Bought by
Oconnell Patrick and Oconnell Margaret
Current Estimated Value
Home Financials for this Owner
Home Financials are based on the most recent Mortgage that was taken out on this home.
Original Mortgage
$238,000
Interest Rate
5.02%
Mortgage Type
Purchase Money Mortgage
Purchase Details
Closed on
Dec 29, 2006
Sold by
Puca Donna
Bought by
Rea Clementina and Rea Danielle
Home Financials for this Owner
Home Financials are based on the most recent Mortgage that was taken out on this home.
Original Mortgage
$308,700
Interest Rate
6.16%
Mortgage Type
Purchase Money Mortgage
Purchase Details
Closed on
Dec 17, 2003
Sold by
Dicamillo Loretta
Bought by
Puca Donna
Home Financials for this Owner
Home Financials are based on the most recent Mortgage that was taken out on this home.
Original Mortgage
$218,000
Interest Rate
5.84%
Mortgage Type
Stand Alone First
Create a Home Valuation Report for This Property
The Home Valuation Report is an in-depth analysis detailing your home's value as well as a comparison with similar homes in the area
Home Values in the Area
Average Home Value in this Area
Purchase History
| Date | Buyer | Sale Price | Title Company |
|---|---|---|---|
| Oconnell Patrick | $338,000 | None Available | |
| Rea Clementina | $343,000 | Commonwealth | |
| Puca Donna | $272,500 | Old Republic National Title |
Source: Public Records
Mortgage History
| Date | Status | Borrower | Loan Amount |
|---|---|---|---|
| Previous Owner | Oconnell Patrick | $238,000 | |
| Previous Owner | Rea Clementina | $308,700 | |
| Previous Owner | Puca Donna | $218,000 |
Source: Public Records
Tax History
| Year | Tax Paid | Tax Assessment Tax Assessment Total Assessment is a certain percentage of the fair market value that is determined by local assessors to be the total taxable value of land and additions on the property. | Land | Improvement |
|---|---|---|---|---|
| 2025 | $4,916 | $34,380 | $4,164 | $30,216 |
| 2024 | $4,928 | $30,540 | $4,423 | $26,117 |
| 2023 | $4,971 | $25,878 | $4,193 | $21,685 |
| 2022 | $4,729 | $29,940 | $5,220 | $24,720 |
| 2021 | $4,796 | $27,540 | $5,220 | $22,320 |
| 2020 | $4,542 | $26,580 | $5,220 | $21,360 |
| 2019 | $4,218 | $25,560 | $5,220 | $20,340 |
| 2018 | $3,737 | $21,565 | $4,937 | $16,628 |
| 2017 | $3,623 | $20,940 | $5,220 | $15,720 |
| 2016 | $3,415 | $20,189 | $4,852 | $15,337 |
| 2015 | $2,840 | $19,047 | $4,452 | $14,595 |
| 2014 | $2,840 | $17,971 | $4,536 | $13,435 |
Source: Public Records
Map
Nearby Homes
- 121 Dahlia St
- 23 Stack Dr
- 107 Cardiff St
- 112 Rosedale Ave
- 119 Boulder St
- 147 Russek Dr Unit 47
- 3 Ebey Ln
- 43 Boulder St
- 127 Stack Dr Unit 35
- 227 Rosedale Ave
- 114 Everton Place
- 115 Covington Cir
- 12 Walker Place
- 45 Russek Dr
- 11 Victoria Rd
- 41 Walker Place
- 14 Dogwood Dr
- 6 Dogwood Dr
- 436 Vineland Ave
- 629 Marcy Ave
- 27 Coventry Loop
- 31 Coventry Loop
- 25 Coventry Loop
- 19 Coventry Loop
- 30 Coventry Loop
- 28 Coventry Loop
- 26 Coventry Loop
- 24 Coventry Loop
- 365 Huguenot Ave
- 17 Coventry Loop
- 22 Coventry Loop
- 20 Coventry Loop
- 363 Huguenot Ave
- 15 Coventry Loop
- 18 Coventry Loop
- 361 Huguenot Ave
- 58 Coventry Loop
- 60 Coventry Loop
- 359 Huguenot Ave
- 62 Coventry Loop
Your Personal Tour Guide
Ask me questions while you tour the home.