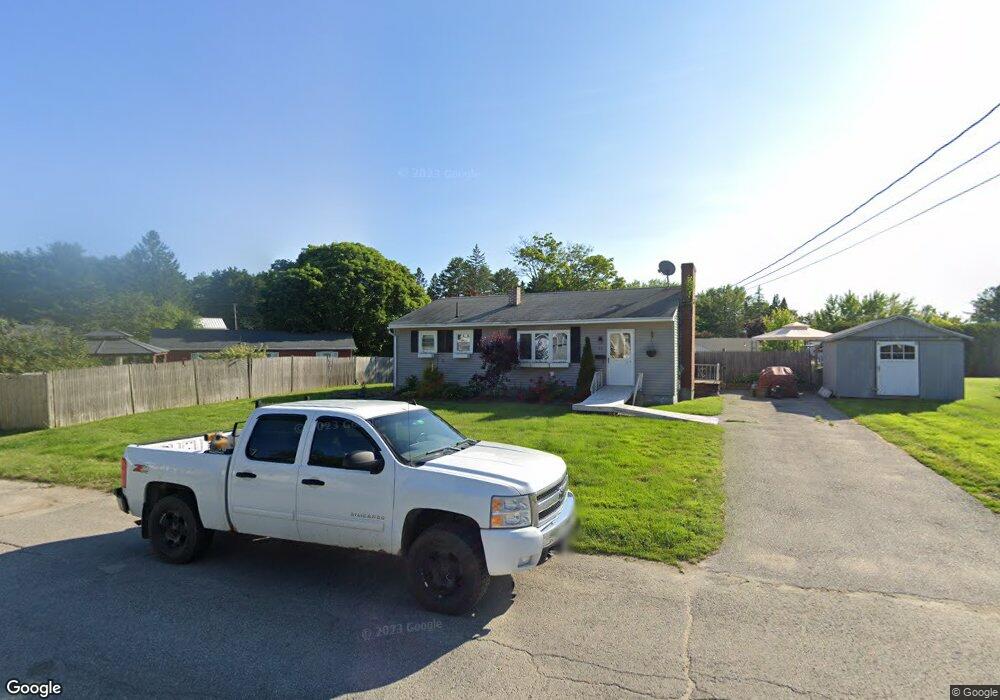
29 Crescent St Brewer, ME 04412
Estimated Value: $227,000 - $275,000
3
Beds
1
Bath
1,000
Sq Ft
$241/Sq Ft
Est. Value
About This Home
This home is located at 29 Crescent St, Brewer, ME 04412 and is currently estimated at $241,416, approximately $241 per square foot. 29 Crescent St is a home with nearby schools including Brewer Community School, Brewer High School, and All Saints Catholic School St. Mary's campus PreK-3.
Ownership History
Date
Name
Owned For
Owner Type
Purchase Details
Closed on
Feb 16, 2018
Sold by
Steiger John
Bought by
Spox Carmen and Steiger John R
Current Estimated Value
Purchase Details
Closed on
Jul 6, 2015
Sold by
Mcphee Dean L Est and Mcphee
Bought by
Steiger John R
Home Financials for this Owner
Home Financials are based on the most recent Mortgage that was taken out on this home.
Original Mortgage
$73,695
Outstanding Balance
$57,403
Interest Rate
3.83%
Mortgage Type
New Conventional
Estimated Equity
$184,013
Create a Home Valuation Report for This Property
The Home Valuation Report is an in-depth analysis detailing your home's value as well as a comparison with similar homes in the area
Home Values in the Area
Average Home Value in this Area
Purchase History
| Date | Buyer | Sale Price | Title Company |
|---|---|---|---|
| Spox Carmen | -- | -- | |
| Spox Carmen | -- | -- | |
| Steiger John R | -- | -- | |
| Steiger John R | -- | -- |
Source: Public Records
Mortgage History
| Date | Status | Borrower | Loan Amount |
|---|---|---|---|
| Open | Steiger John R | $73,695 | |
| Closed | Steiger John R | $73,695 |
Source: Public Records
Tax History Compared to Growth
Tax History
| Year | Tax Paid | Tax Assessment Tax Assessment Total Assessment is a certain percentage of the fair market value that is determined by local assessors to be the total taxable value of land and additions on the property. | Land | Improvement |
|---|---|---|---|---|
| 2024 | $3,149 | $167,500 | $28,200 | $139,300 |
| 2023 | $3,011 | $149,800 | $26,200 | $123,600 |
| 2021 | $2,957 | $132,600 | $25,900 | $106,700 |
| 2020 | $3,017 | $132,600 | $25,900 | $106,700 |
| 2019 | $2,697 | $132,600 | $25,900 | $106,700 |
| 2018 | $2,639 | $117,300 | $25,900 | $91,400 |
| 2017 | $2,639 | $117,300 | $25,900 | $91,400 |
| 2016 | $2,524 | $117,300 | $25,900 | $91,400 |
| 2015 | $2,524 | $117,300 | $25,900 | $91,400 |
| 2014 | $2,454 | $117,300 | $25,900 | $91,400 |
| 2013 | $2,594 | $124,000 | $22,200 | $101,800 |
Source: Public Records
Map
Nearby Homes