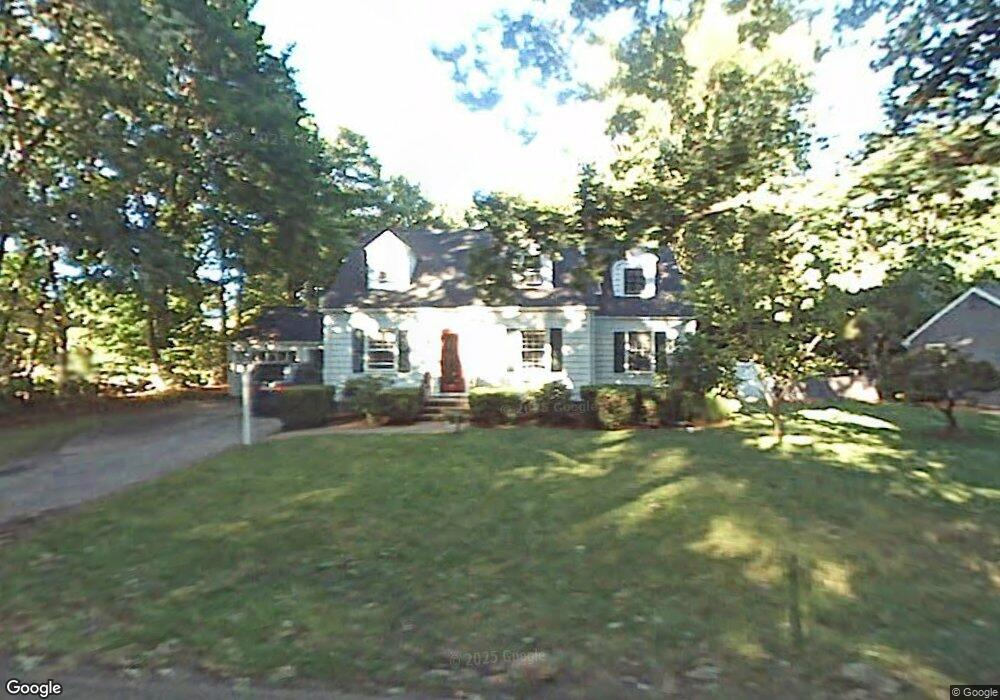
29 Cross St Shrewsbury, MA 01545
Estimated Value: $640,000 - $784,000
4
Beds
3
Baths
2,783
Sq Ft
$256/Sq Ft
Est. Value
About This Home
This home is located at 29 Cross St, Shrewsbury, MA 01545 and is currently estimated at $713,241, approximately $256 per square foot. 29 Cross St is a home located in Worcester County with nearby schools including Spring Street Elementary School, Sherwood Middle School, and Oak Middle School.
Ownership History
Date
Name
Owned For
Owner Type
Purchase Details
Closed on
Oct 29, 1993
Sold by
Melden Kurt A and Martin Therese
Bought by
North Jeffrey and North Julie
Current Estimated Value
Home Financials for this Owner
Home Financials are based on the most recent Mortgage that was taken out on this home.
Original Mortgage
$156,600
Interest Rate
6.86%
Mortgage Type
Purchase Money Mortgage
Create a Home Valuation Report for This Property
The Home Valuation Report is an in-depth analysis detailing your home's value as well as a comparison with similar homes in the area
Home Values in the Area
Average Home Value in this Area
Purchase History
| Date | Buyer | Sale Price | Title Company |
|---|---|---|---|
| North Jeffrey | $174,000 | -- | |
| North Jeffrey | $174,000 | -- |
Source: Public Records
Mortgage History
| Date | Status | Borrower | Loan Amount |
|---|---|---|---|
| Open | North Jeffrey | $140,000 | |
| Closed | North Jeffrey | $28,000 | |
| Closed | North Jeffrey | $156,600 |
Source: Public Records
Tax History Compared to Growth
Tax History
| Year | Tax Paid | Tax Assessment Tax Assessment Total Assessment is a certain percentage of the fair market value that is determined by local assessors to be the total taxable value of land and additions on the property. | Land | Improvement |
|---|---|---|---|---|
| 2025 | $72 | $597,200 | $289,300 | $307,900 |
| 2024 | $6,805 | $549,700 | $275,600 | $274,100 |
| 2023 | $6,593 | $502,500 | $275,600 | $226,900 |
| 2022 | $6,242 | $442,400 | $216,500 | $225,900 |
| 2021 | $5,473 | $414,900 | $216,500 | $198,400 |
| 2020 | $5,174 | $414,900 | $216,500 | $198,400 |
| 2019 | $4,985 | $396,600 | $201,900 | $194,700 |
| 2018 | $4,844 | $382,600 | $189,500 | $193,100 |
| 2017 | $4,679 | $364,700 | $171,600 | $193,100 |
| 2016 | $4,594 | $353,400 | $160,600 | $192,800 |
| 2015 | $4,245 | $321,600 | $146,200 | $175,400 |
Source: Public Records
Map
Nearby Homes
- 10 Karen Ave
- 5 Highland Hill Dr
- 2 Applewood Cir
- Lot 11 High St
- 17 Wilder Rd
- 7 Northland Rd
- 20 Olde Colony Dr
- 11 Adin Dr
- 26 Blackthorn Rd
- 40 High St
- 11 Country Way
- 11 Cranbrook Rd
- 26 High St
- 9 Morningside Dr
- 148 Spring St
- 209 North St
- 7 Holman Heights Cir
- 20 Rawson Hill Dr
- 251 Boylston St Unit 253
- 34 Gates Rd