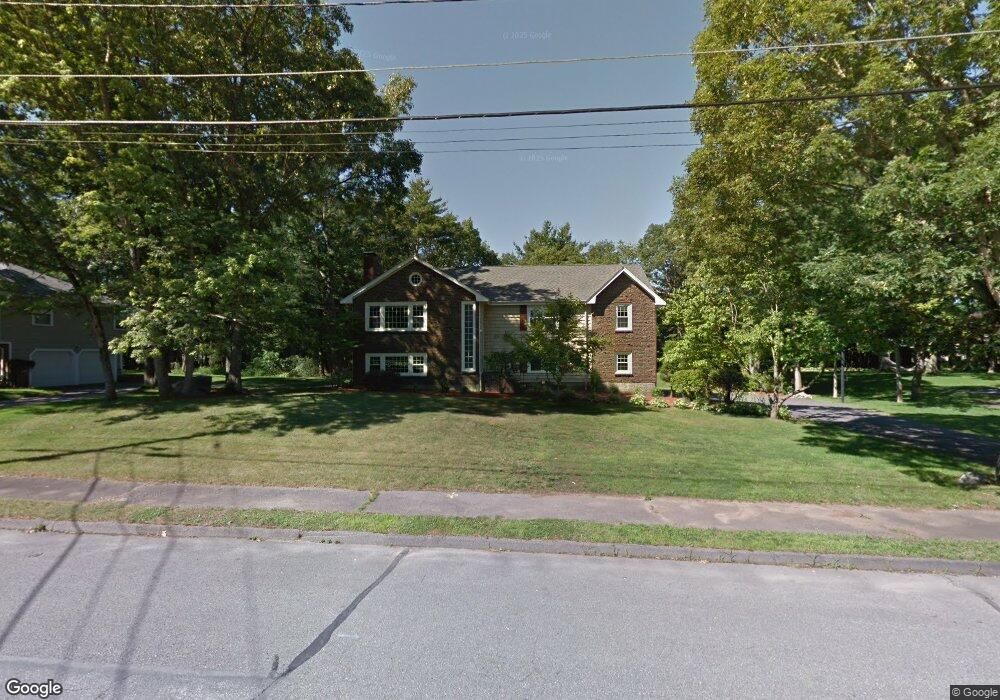
29 Cypress St Medfield, MA 02052
Estimated Value: $912,000 - $978,000
4
Beds
3
Baths
1,947
Sq Ft
$481/Sq Ft
Est. Value
About This Home
This home is located at 29 Cypress St, Medfield, MA 02052 and is currently estimated at $937,406, approximately $481 per square foot. 29 Cypress St is a home located in Norfolk County with nearby schools including Memorial School, Ralph Wheelock School, and Dale Street School.
Ownership History
Date
Name
Owned For
Owner Type
Purchase Details
Closed on
Apr 17, 2003
Sold by
Barrese Marie P and Barrese Robert L
Bought by
Fedor Jeffrey B and Fedor Jill M
Current Estimated Value
Purchase Details
Closed on
Jun 26, 1989
Sold by
Steranko James J
Bought by
Barrese Robert L
Create a Home Valuation Report for This Property
The Home Valuation Report is an in-depth analysis detailing your home's value as well as a comparison with similar homes in the area
Home Values in the Area
Average Home Value in this Area
Purchase History
| Date | Buyer | Sale Price | Title Company |
|---|---|---|---|
| Fedor Jeffrey B | $401,000 | -- | |
| Fedor Jeffrey B | $401,000 | -- | |
| Barrese Robert L | $238,700 | -- | |
| Barrese Robert L | $238,700 | -- |
Source: Public Records
Mortgage History
| Date | Status | Borrower | Loan Amount |
|---|---|---|---|
| Open | Barrese Robert L | $310,000 | |
| Closed | Barrese Robert L | $320,000 |
Source: Public Records
Tax History
| Year | Tax Paid | Tax Assessment Tax Assessment Total Assessment is a certain percentage of the fair market value that is determined by local assessors to be the total taxable value of land and additions on the property. | Land | Improvement |
|---|---|---|---|---|
| 2025 | $10,765 | $780,100 | $469,400 | $310,700 |
| 2024 | $10,273 | $701,700 | $421,000 | $280,700 |
| 2023 | $10,147 | $657,600 | $403,500 | $254,100 |
| 2022 | $10,017 | $575,000 | $385,900 | $189,100 |
| 2021 | $9,770 | $550,100 | $382,400 | $167,700 |
| 2020 | $9,548 | $535,500 | $373,700 | $161,800 |
| 2019 | $9,280 | $519,300 | $363,100 | $156,200 |
| 2018 | $8,552 | $502,200 | $350,900 | $151,300 |
| 2017 | $8,421 | $498,600 | $347,300 | $151,300 |
| 2016 | $9,058 | $540,800 | $389,500 | $151,300 |
| 2015 | $7,682 | $478,900 | $337,400 | $141,500 |
| 2014 | $7,085 | $439,500 | $298,000 | $141,500 |
Source: Public Records
Map
Nearby Homes
- 23 Winter St
- 21 Winter St
- 3 Shining Valley Cir
- 433 Main St Unit 4
- 40 Hearthstone Dr
- 8 Turtlebrook Way
- 34 Frairy St
- 12 Belknap Rd
- 17 Fairview Rd
- 4 Blacksmith Dr
- 3 Copperwood Rd
- 22 Sunset Way Unit 22
- 144 Pine St
- 161 Farm St
- 2 Partridge Hill Rd
- 111 Elm St
- 17 Bridle Path
- 93 Walpole St
- 29 Hartford St
- 114 Farm St