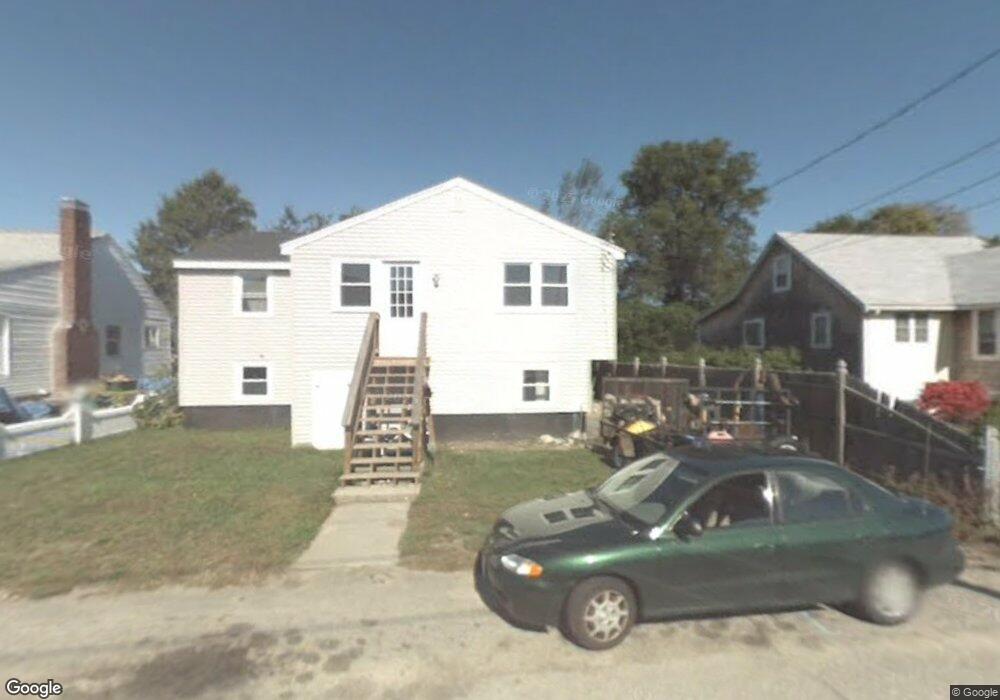
29 D St Unit 2 Hull, MA 02045
The Alphabets NeighborhoodEstimated Value: $563,076 - $732,000
3
Beds
1
Bath
1,000
Sq Ft
$652/Sq Ft
Est. Value
About This Home
This home is located at 29 D St Unit 2, Hull, MA 02045 and is currently estimated at $652,019, approximately $652 per square foot. 29 D St Unit 2 is a home located in Plymouth County with nearby schools including Lillian M. Jacobs Elementary School, Memorial Middle School, and Hull High School.
Ownership History
Date
Name
Owned For
Owner Type
Purchase Details
Closed on
Feb 27, 2014
Sold by
Rochelle K Greene Ret and Greene
Bought by
Sand & Sea Rentals Llc
Current Estimated Value
Purchase Details
Closed on
Jan 3, 2013
Sold by
Greene Rochelle K and Jacobson David C
Bought by
Rochelle K Greene Ret and Greene
Purchase Details
Closed on
Sep 18, 2003
Sold by
Ohare Robert
Bought by
Schmidt Paul
Purchase Details
Closed on
Jul 1, 1998
Sold by
Mitchell Brian and Mitchell Constance M
Bought by
Ohare Robert
Home Financials for this Owner
Home Financials are based on the most recent Mortgage that was taken out on this home.
Original Mortgage
$134,130
Interest Rate
7.04%
Mortgage Type
Purchase Money Mortgage
Purchase Details
Closed on
Aug 2, 1991
Sold by
Barry David F and Barry Judith E
Bought by
Mitchell Brian and Harrison Constance
Create a Home Valuation Report for This Property
The Home Valuation Report is an in-depth analysis detailing your home's value as well as a comparison with similar homes in the area
Home Values in the Area
Average Home Value in this Area
Purchase History
| Date | Buyer | Sale Price | Title Company |
|---|---|---|---|
| Sand & Sea Rentals Llc | -- | -- | |
| Rochelle K Greene Ret | -- | -- | |
| Schmidt Paul | $226,400 | -- | |
| Ohare Robert | $131,500 | -- | |
| Ohare Robert | $131,500 | -- | |
| Mitchell Brian | $75,000 | -- | |
| Mitchell Brian | $75,000 | -- |
Source: Public Records
Mortgage History
| Date | Status | Borrower | Loan Amount |
|---|---|---|---|
| Previous Owner | Mitchell Brian | $134,130 | |
| Previous Owner | Mitchell Brian | $19,000 |
Source: Public Records
Tax History Compared to Growth
Tax History
| Year | Tax Paid | Tax Assessment Tax Assessment Total Assessment is a certain percentage of the fair market value that is determined by local assessors to be the total taxable value of land and additions on the property. | Land | Improvement |
|---|---|---|---|---|
| 2025 | $4,763 | $425,300 | $212,600 | $212,700 |
| 2024 | $4,574 | $392,600 | $202,700 | $189,900 |
| 2023 | $4,538 | $372,900 | $196,200 | $176,700 |
| 2022 | $4,374 | $348,800 | $183,100 | $165,700 |
| 2021 | $4,529 | $357,200 | $163,500 | $193,700 |
| 2020 | $4,947 | $385,900 | $170,000 | $215,900 |
| 2019 | $5,033 | $385,700 | $157,000 | $228,700 |
| 2018 | $4,799 | $357,600 | $157,000 | $200,600 |
| 2017 | $4,753 | $346,400 | $157,000 | $189,400 |
| 2016 | $4,478 | $332,200 | $143,900 | $188,300 |
| 2015 | $4,312 | $309,300 | $121,000 | $188,300 |
| 2014 | $4,210 | $303,500 | $111,200 | $192,300 |
Source: Public Records
Map
Nearby Homes