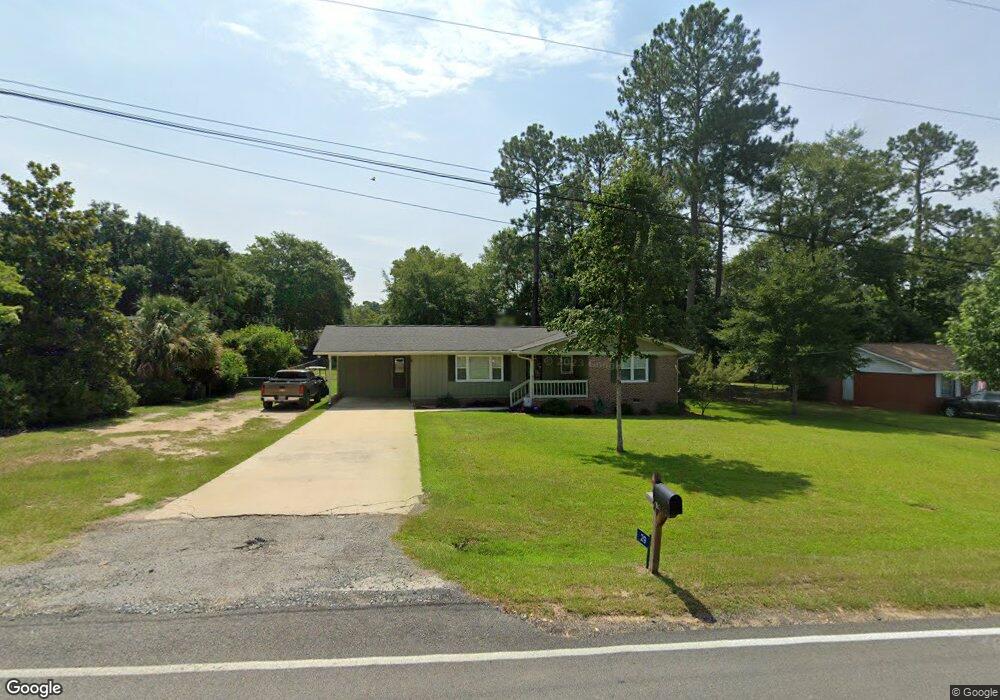
29 Daniels St Unit 412 Hawkinsville, GA 31036
Estimated Value: $205,496 - $225,000
3
Beds
3
Baths
1,550
Sq Ft
$137/Sq Ft
Est. Value
About This Home
This home is located at 29 Daniels St Unit 412, Hawkinsville, GA 31036 and is currently estimated at $213,124, approximately $137 per square foot. 29 Daniels St Unit 412 is a home located in Pulaski County with nearby schools including Pulaski County Elementary School, Pulaski County Middle School, and Hawkinsville High School.
Ownership History
Date
Name
Owned For
Owner Type
Purchase Details
Closed on
Mar 10, 2025
Sold by
Roberts Henry Coby
Bought by
Thompson Bowen Parker
Current Estimated Value
Home Financials for this Owner
Home Financials are based on the most recent Mortgage that was taken out on this home.
Original Mortgage
$15,000
Outstanding Balance
$14,790
Interest Rate
6.89%
Mortgage Type
New Conventional
Estimated Equity
$198,334
Purchase Details
Closed on
Aug 23, 2019
Sold by
Hudgins Shawn R
Bought by
Roberts Henry Coby
Home Financials for this Owner
Home Financials are based on the most recent Mortgage that was taken out on this home.
Original Mortgage
$97,474
Interest Rate
3.7%
Mortgage Type
New Conventional
Purchase Details
Closed on
Dec 31, 2015
Sold by
Orr James E
Bought by
Orr James E
Purchase Details
Closed on
Jul 31, 1995
Bought by
Orr James E Etal
Purchase Details
Closed on
Jan 7, 1994
Bought by
Pipes William Roy Et
Create a Home Valuation Report for This Property
The Home Valuation Report is an in-depth analysis detailing your home's value as well as a comparison with similar homes in the area
Home Values in the Area
Average Home Value in this Area
Purchase History
| Date | Buyer | Sale Price | Title Company |
|---|---|---|---|
| Thompson Bowen Parker | $208,000 | -- | |
| Roberts Henry Coby | $96,500 | -- | |
| Orr James E | $82,600 | -- | |
| Orr James E Etal | $58,500 | -- | |
| Pipes William Roy Et | $59,500 | -- |
Source: Public Records
Mortgage History
| Date | Status | Borrower | Loan Amount |
|---|---|---|---|
| Open | Thompson Bowen Parker | $15,000 | |
| Open | Thompson Bowen Parker | $204,212 | |
| Previous Owner | Roberts Henry Coby | $97,474 |
Source: Public Records
Tax History Compared to Growth
Tax History
| Year | Tax Paid | Tax Assessment Tax Assessment Total Assessment is a certain percentage of the fair market value that is determined by local assessors to be the total taxable value of land and additions on the property. | Land | Improvement |
|---|---|---|---|---|
| 2024 | $1,799 | $66,558 | $4,480 | $62,078 |
| 2023 | $1,799 | $30,149 | $2,419 | $27,730 |
| 2022 | $1,008 | $30,149 | $2,419 | $27,730 |
| 2021 | $1,011 | $30,149 | $2,419 | $27,730 |
| 2020 | $1,014 | $30,149 | $2,419 | $27,730 |
| 2019 | $1,013 | $30,149 | $2,419 | $27,730 |
| 2018 | $1,014 | $30,149 | $2,419 | $27,730 |
| 2017 | $867 | $30,149 | $2,419 | $27,730 |
| 2016 | $957 | $30,150 | $2,419 | $27,730 |
| 2015 | -- | $30,150 | $2,419 | $27,730 |
| 2014 | -- | $30,150 | $2,419 | $27,730 |
| 2013 | -- | $30,149 | $2,419 | $27,730 |
Source: Public Records
Map
Nearby Homes
- 29 Daniel St
- 8 Valley Rd Unit 600
- 14 Pine Level Dr
- 51 Merritt St
- 30 Lee St
- 105 Westgate Plaza
- 97 Westgate Plaza
- 44 Palmer Cir
- 2 Lee St
- 1 Lee St
- 14 Kibbee St
- Unadilla HWY Lenora Dr
- 0 Craftway Dr Unit 253517
- 15 Merritt St
- 13 S Lumpkin St
- 305 Broad St
- 49 Palmer Cir
- 46 Palmer Cir
- 1301 Georgia 26
- 6.44 +/- acres Georgia 26
- 23 Daniels St Unit 410
- 26 Daniel St
- 22 Daniel St Unit 407
- 17 Daniel St Unit 408
- 30 Daniel St
- 30 Daniel St
- 22 Brookside Dr
- 16 Daniel St Unit 419
- 404 Daniel St
- 0 Daniel St
- 33 Daniel St Unit 414
- 18 Brookside Dr
- 117 Mccormick Ave
- 34 Daniel St Unit 413
- 111 Mccormick Ave
- 11 Daniel St Unit 406
- 121 Mccormick Ave Unit 412
- 30 Brookside Dr
- 107 Mccormick Ave
- 107 Mccormick Ave