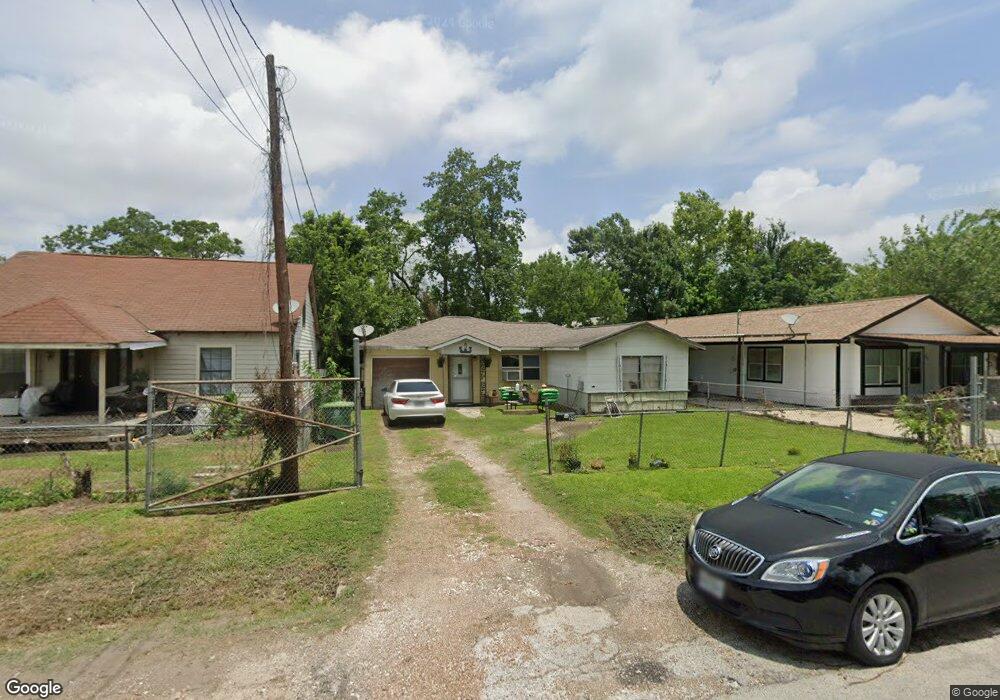
29 De Boll St Houston, TX 77022
Northside-Northline NeighborhoodEstimated Value: $149,209 - $203,000
3
Beds
1
Bath
1,060
Sq Ft
$165/Sq Ft
Est. Value
About This Home
This home is located at 29 De Boll St, Houston, TX 77022 and is currently estimated at $175,052, approximately $165 per square foot. 29 De Boll St is a home located in Harris County with nearby schools including Burbank Elementary School, Burbank Middle School, and Sam Houston Math, Science & Technology Center.
Ownership History
Date
Name
Owned For
Owner Type
Purchase Details
Closed on
Jul 13, 2001
Sold by
Lawrence Antoinette B
Bought by
Ventura Rosa
Current Estimated Value
Home Financials for this Owner
Home Financials are based on the most recent Mortgage that was taken out on this home.
Original Mortgage
$36,000
Outstanding Balance
$13,914
Interest Rate
7.18%
Mortgage Type
Seller Take Back
Estimated Equity
$161,138
Create a Home Valuation Report for This Property
The Home Valuation Report is an in-depth analysis detailing your home's value as well as a comparison with similar homes in the area
Home Values in the Area
Average Home Value in this Area
Purchase History
| Date | Buyer | Sale Price | Title Company |
|---|---|---|---|
| Ventura Rosa | -- | -- |
Source: Public Records
Mortgage History
| Date | Status | Borrower | Loan Amount |
|---|---|---|---|
| Open | Ventura Rosa | $36,000 |
Source: Public Records
Tax History Compared to Growth
Tax History
| Year | Tax Paid | Tax Assessment Tax Assessment Total Assessment is a certain percentage of the fair market value that is determined by local assessors to be the total taxable value of land and additions on the property. | Land | Improvement |
|---|---|---|---|---|
| 2025 | $787 | $127,604 | $61,425 | $66,179 |
| 2024 | $787 | $127,604 | $61,425 | $66,179 |
| 2023 | $787 | $117,181 | $61,425 | $55,756 |
| 2022 | $1,459 | $94,689 | $46,800 | $47,889 |
| 2021 | $1,404 | $83,716 | $46,800 | $36,916 |
| 2020 | $1,326 | $74,553 | $46,800 | $27,753 |
| 2019 | $1,260 | $59,673 | $30,713 | $28,960 |
| 2018 | $619 | $52,669 | $30,713 | $21,956 |
| 2017 | $1,040 | $52,669 | $30,713 | $21,956 |
| 2016 | $946 | $51,570 | $30,713 | $20,857 |
| 2015 | $522 | $34,000 | $30,713 | $3,287 |
| 2014 | $522 | $34,000 | $30,713 | $3,287 |
Source: Public Records
Map
Nearby Homes
- 70 Burress St
- 44 Farrell St
- 90 Burress St Unit B
- 90 Burress St Unit A
- 45 Wellford St
- Cypress Plan at Wellford Village
- Willow Plan at Wellford Village
- 61 Trenwood Ln
- 0 Burbank St Unit 9886770
- 9625 Fulton St
- 91 Burbank St
- 56 Wellford St
- 104 Luetta St
- 106 Luetta St
- 108 Luetta St
- 110 Luetta St
- 108 Fichter St
- 40 Dipping Ln
- 46 Dipping Ln
- 58 Dipping Ln