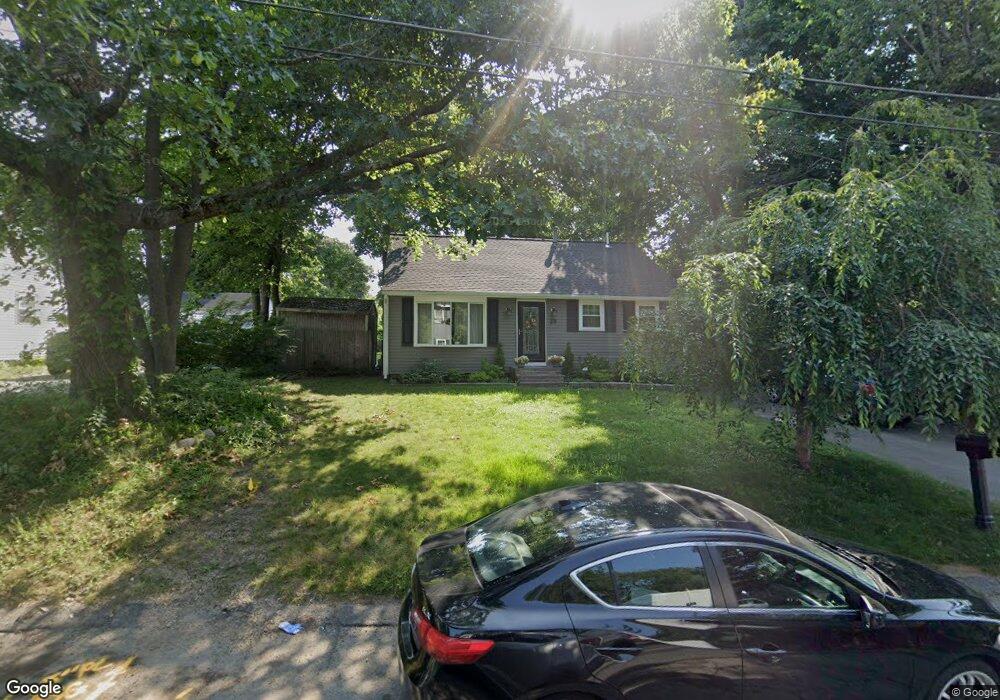
29 Douglas Rd Brockton, MA 02302
Estimated Value: $486,000 - $533,000
3
Beds
1
Bath
1,394
Sq Ft
$364/Sq Ft
Est. Value
About This Home
This home is located at 29 Douglas Rd, Brockton, MA 02302 and is currently estimated at $506,904, approximately $363 per square foot. 29 Douglas Rd is a home located in Plymouth County with nearby schools including Brookfield Elementary School, Mary E. Baker Elementary School, and Downey Elementary School.
Ownership History
Date
Name
Owned For
Owner Type
Purchase Details
Closed on
Nov 25, 2003
Sold by
Maiolino Peter V and Maiolino Ellisa J
Bought by
Teixeira Antero and Teixeira Madeline
Current Estimated Value
Home Financials for this Owner
Home Financials are based on the most recent Mortgage that was taken out on this home.
Original Mortgage
$255,911
Outstanding Balance
$119,412
Interest Rate
5.98%
Mortgage Type
Purchase Money Mortgage
Estimated Equity
$387,492
Create a Home Valuation Report for This Property
The Home Valuation Report is an in-depth analysis detailing your home's value as well as a comparison with similar homes in the area
Home Values in the Area
Average Home Value in this Area
Purchase History
| Date | Buyer | Sale Price | Title Company |
|---|---|---|---|
| Teixeira Antero | $259,900 | -- |
Source: Public Records
Mortgage History
| Date | Status | Borrower | Loan Amount |
|---|---|---|---|
| Open | Teixeira Antero | $20,000 | |
| Open | Teixeira Antero | $255,911 | |
| Previous Owner | Teixeira Antero | $92,000 |
Source: Public Records
Tax History Compared to Growth
Tax History
| Year | Tax Paid | Tax Assessment Tax Assessment Total Assessment is a certain percentage of the fair market value that is determined by local assessors to be the total taxable value of land and additions on the property. | Land | Improvement |
|---|---|---|---|---|
| 2025 | $5,170 | $426,900 | $144,300 | $282,600 |
| 2024 | $4,970 | $413,500 | $144,300 | $269,200 |
| 2023 | $4,524 | $348,500 | $109,100 | $239,400 |
| 2022 | $4,367 | $312,600 | $99,100 | $213,500 |
| 2021 | $4,305 | $296,900 | $92,300 | $204,600 |
| 2020 | $4,186 | $276,300 | $88,600 | $187,700 |
| 2019 | $4,103 | $264,000 | $82,300 | $181,700 |
| 2018 | $3,501 | $218,000 | $82,300 | $135,700 |
| 2017 | $3,207 | $199,200 | $82,300 | $116,900 |
| 2016 | $3,531 | $203,400 | $78,500 | $124,900 |
| 2015 | $3,222 | $177,500 | $78,500 | $99,000 |
| 2014 | $3,059 | $168,700 | $78,500 | $90,200 |
Source: Public Records
Map
Nearby Homes
- 75 Guild Rd
- 2 Dundee St
- 383 Quincy St
- 10 Exeter St
- 43 Pinehurst Ave
- 111 Ames Rd
- 92 Gloucester St
- 11 Sterling Rd
- 146 Gloucester St
- 59 Sharon St
- 92 Debbie Rd Unit Lot 17
- 76 Quincy St Unit Lot 1
- 232 Bates Rd
- 209 Bates Rd
- 104 Crestfield Dr
- 87 Sherman St
- 15 Quincy St
- 1002 Court St
- 16 Davis St
- 93 Porter St