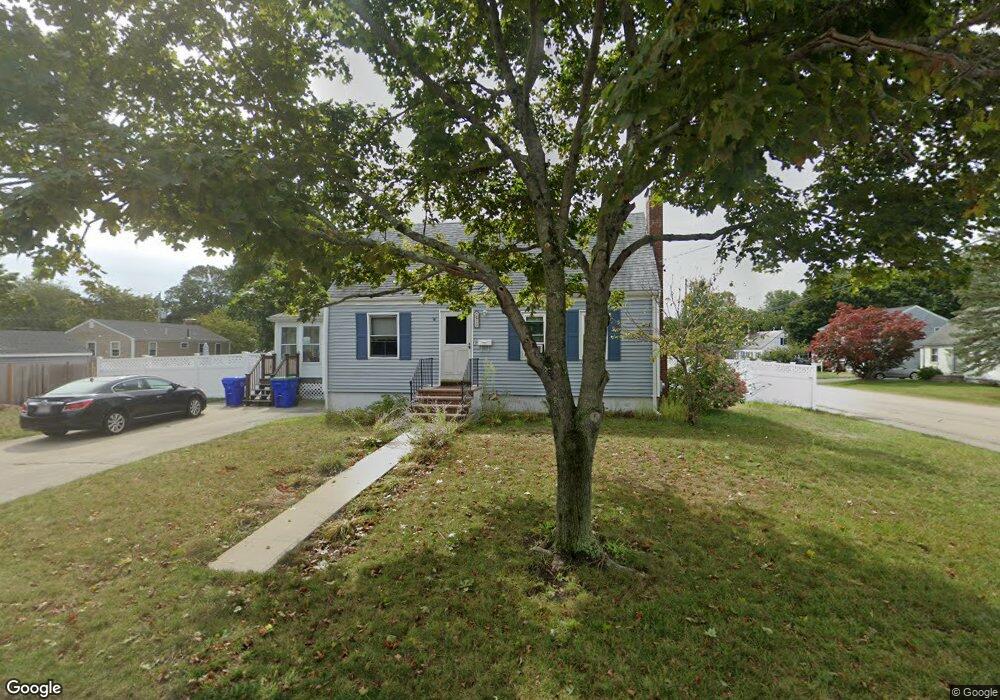
29 Dowd Rd Rockland, MA 02370
Estimated Value: $555,000 - $588,000
3
Beds
2
Baths
1,344
Sq Ft
$426/Sq Ft
Est. Value
About This Home
This home is located at 29 Dowd Rd, Rockland, MA 02370 and is currently estimated at $572,509, approximately $425 per square foot. 29 Dowd Rd is a home located in Plymouth County with nearby schools including Rockland Senior High School, Calvary Chapel Academy, and Holy Family Elementary School.
Ownership History
Date
Name
Owned For
Owner Type
Purchase Details
Closed on
Sep 9, 2016
Sold by
Austin Sharlene H
Bought by
Austin Sharlene H and Austin Peter V
Current Estimated Value
Purchase Details
Closed on
Sep 13, 1996
Sold by
Morrison Clifford L
Bought by
Morrison Sharlene H
Create a Home Valuation Report for This Property
The Home Valuation Report is an in-depth analysis detailing your home's value as well as a comparison with similar homes in the area
Home Values in the Area
Average Home Value in this Area
Purchase History
| Date | Buyer | Sale Price | Title Company |
|---|---|---|---|
| Austin Sharlene H | -- | -- | |
| Morrison Sharlene H | $128,000 | -- |
Source: Public Records
Mortgage History
| Date | Status | Borrower | Loan Amount |
|---|---|---|---|
| Previous Owner | Morrison Sharlene H | $185,000 | |
| Previous Owner | Morrison Sharlene H | $55,000 | |
| Previous Owner | Morrison Sharlene H | $125,000 |
Source: Public Records
Tax History Compared to Growth
Tax History
| Year | Tax Paid | Tax Assessment Tax Assessment Total Assessment is a certain percentage of the fair market value that is determined by local assessors to be the total taxable value of land and additions on the property. | Land | Improvement |
|---|---|---|---|---|
| 2025 | $6,522 | $477,100 | $224,300 | $252,800 |
| 2024 | $6,331 | $450,300 | $211,600 | $238,700 |
| 2023 | $6,335 | $416,200 | $194,100 | $222,100 |
| 2022 | $6,070 | $362,400 | $168,800 | $193,600 |
| 2021 | $5,744 | $332,400 | $153,400 | $179,000 |
| 2020 | $5,573 | $318,900 | $146,200 | $172,700 |
| 2019 | $5,485 | $306,100 | $139,200 | $166,900 |
| 2018 | $5,146 | $283,300 | $139,200 | $144,100 |
| 2017 | $5,028 | $272,100 | $139,200 | $132,900 |
| 2016 | $4,822 | $260,800 | $133,900 | $126,900 |
| 2015 | $4,605 | $242,000 | $125,100 | $116,900 |
| 2014 | $4,354 | $237,400 | $122,700 | $114,700 |
Source: Public Records
Map
Nearby Homes