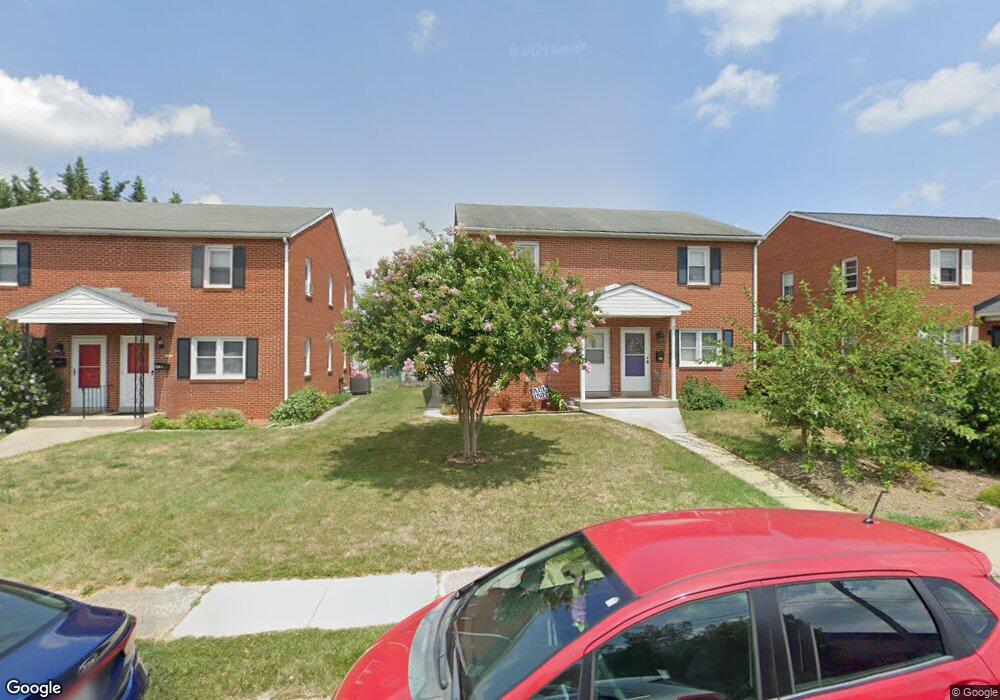
29 E 9th St Frederick, MD 21701
Selwyn Farms NeighborhoodEstimated Value: $298,000 - $396,272
Studio
2
Baths
1,120
Sq Ft
$318/Sq Ft
Est. Value
About This Home
This home is located at 29 E 9th St, Frederick, MD 21701 and is currently estimated at $356,318, approximately $318 per square foot. 29 E 9th St is a home located in Frederick County with nearby schools including North Frederick Elementary School, Gov. Thomas Johnson Middle School, and Gov. Thomas Johnson High School.
Ownership History
Date
Name
Owned For
Owner Type
Purchase Details
Closed on
Dec 20, 2002
Sold by
Day Dawn Marie
Bought by
Morales Dawn M Day and Morales Manuel Angel
Current Estimated Value
Purchase Details
Closed on
Jun 1, 2000
Sold by
Zimmerman Rita J
Bought by
Day Dawn Marie and Day Manuel Angel
Purchase Details
Closed on
Nov 16, 1992
Sold by
Feaga, Jay K
Bought by
Zimmerman Rita J
Create a Home Valuation Report for This Property
The Home Valuation Report is an in-depth analysis detailing your home's value as well as a comparison with similar homes in the area
Home Values in the Area
Average Home Value in this Area
Purchase History
| Date | Buyer | Sale Price | Title Company |
|---|---|---|---|
| Morales Dawn M Day | -- | -- | |
| Day Dawn Marie | $98,000 | -- | |
| Zimmerman Rita J | $86,000 | -- |
Source: Public Records
Mortgage History
| Date | Status | Borrower | Loan Amount |
|---|---|---|---|
| Closed | Day Dawn Marie | -- |
Source: Public Records
Tax History
| Year | Tax Paid | Tax Assessment Tax Assessment Total Assessment is a certain percentage of the fair market value that is determined by local assessors to be the total taxable value of land and additions on the property. | Land | Improvement |
|---|---|---|---|---|
| 2025 | $5,006 | $300,600 | $102,200 | $198,400 |
| 2024 | $5,006 | $281,267 | $0 | $0 |
| 2023 | $4,632 | $261,933 | $0 | $0 |
| 2022 | $4,393 | $242,600 | $87,100 | $155,500 |
| 2021 | $4,205 | $237,667 | $0 | $0 |
| 2020 | $4,205 | $232,733 | $0 | $0 |
| 2019 | $4,116 | $227,800 | $79,700 | $148,100 |
| 2018 | $4,028 | $221,100 | $0 | $0 |
| 2017 | $3,842 | $227,800 | $0 | $0 |
| 2016 | $3,068 | $207,700 | $0 | $0 |
| 2015 | $3,068 | $201,267 | $0 | $0 |
| 2014 | $3,068 | $194,833 | $0 | $0 |
Source: Public Records
Map
Nearby Homes
Your Personal Tour Guide
Ask me questions while you tour the home.