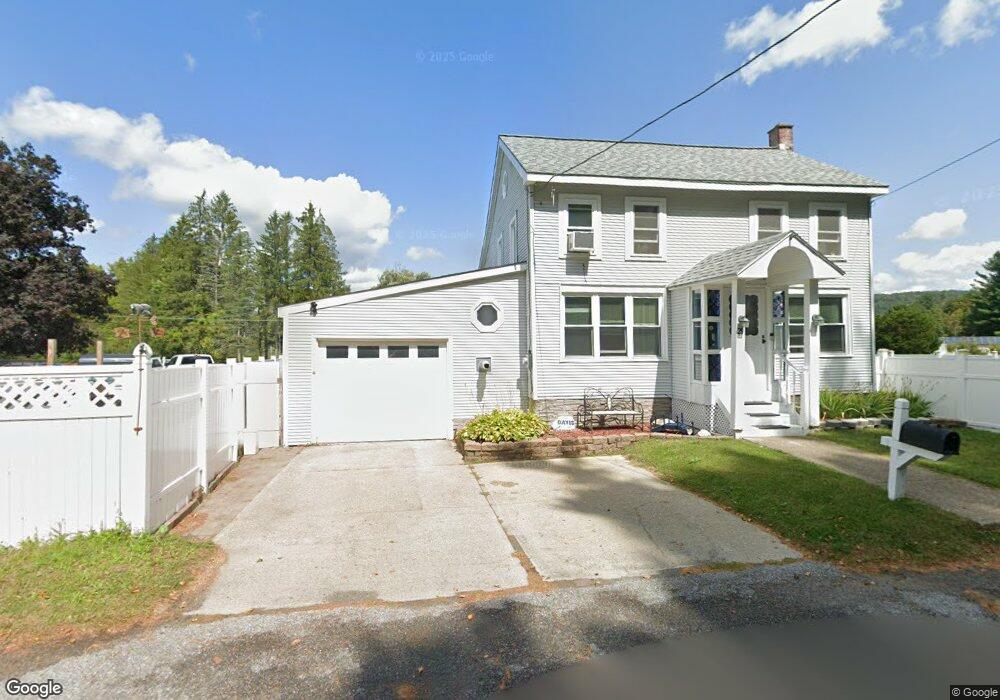
29 E Main St Cheshire, MA 01225
Estimated Value: $277,000 - $310,000
3
Beds
2
Baths
1,547
Sq Ft
$187/Sq Ft
Est. Value
About This Home
This home is located at 29 E Main St, Cheshire, MA 01225 and is currently estimated at $289,608, approximately $187 per square foot. 29 E Main St is a home located in Berkshire County with nearby schools including Hoosac Valley Middle & High School.
Ownership History
Date
Name
Owned For
Owner Type
Purchase Details
Closed on
Mar 16, 2001
Sold by
Thomspon Brenda J
Bought by
Davis Jason A and Davis Jennifer A
Current Estimated Value
Home Financials for this Owner
Home Financials are based on the most recent Mortgage that was taken out on this home.
Original Mortgage
$126,996
Interest Rate
7.01%
Mortgage Type
Purchase Money Mortgage
Purchase Details
Closed on
Sep 27, 1995
Sold by
Bratcher Scott D and Bratcher Mary F
Bought by
Thompson Brenda J
Purchase Details
Closed on
Dec 15, 1988
Sold by
Schorge Ralph J
Bought by
Bratcher Scott D
Create a Home Valuation Report for This Property
The Home Valuation Report is an in-depth analysis detailing your home's value as well as a comparison with similar homes in the area
Home Values in the Area
Average Home Value in this Area
Purchase History
| Date | Buyer | Sale Price | Title Company |
|---|---|---|---|
| Davis Jason A | $128,000 | -- | |
| Davis Jason A | $128,000 | -- | |
| Thompson Brenda J | $109,600 | -- | |
| Thompson Brenda J | $109,600 | -- | |
| Bratcher Scott D | $85,000 | -- |
Source: Public Records
Mortgage History
| Date | Status | Borrower | Loan Amount |
|---|---|---|---|
| Open | Bratcher Scott D | $149,000 | |
| Closed | Bratcher Scott D | $126,996 |
Source: Public Records
Tax History
| Year | Tax Paid | Tax Assessment Tax Assessment Total Assessment is a certain percentage of the fair market value that is determined by local assessors to be the total taxable value of land and additions on the property. | Land | Improvement |
|---|---|---|---|---|
| 2025 | $2,821 | $253,500 | $44,300 | $209,200 |
| 2024 | $2,770 | $239,400 | $42,400 | $197,000 |
| 2023 | $2,643 | $220,800 | $45,000 | $175,800 |
| 2022 | $2,399 | $188,000 | $47,200 | $140,800 |
| 2021 | $3,205 | $179,000 | $45,000 | $134,000 |
| 2020 | $513 | $177,800 | $45,000 | $132,800 |
| 2019 | $2,372 | $181,100 | $49,900 | $131,200 |
| 2018 | $2,233 | $174,900 | $49,900 | $125,000 |
| 2017 | $2,167 | $174,900 | $49,900 | $125,000 |
| 2016 | $2,181 | $177,900 | $49,900 | $128,000 |
| 2015 | $2,085 | $174,600 | $44,600 | $130,000 |
Source: Public Records
Map
Nearby Homes
Your Personal Tour Guide
Ask me questions while you tour the home.