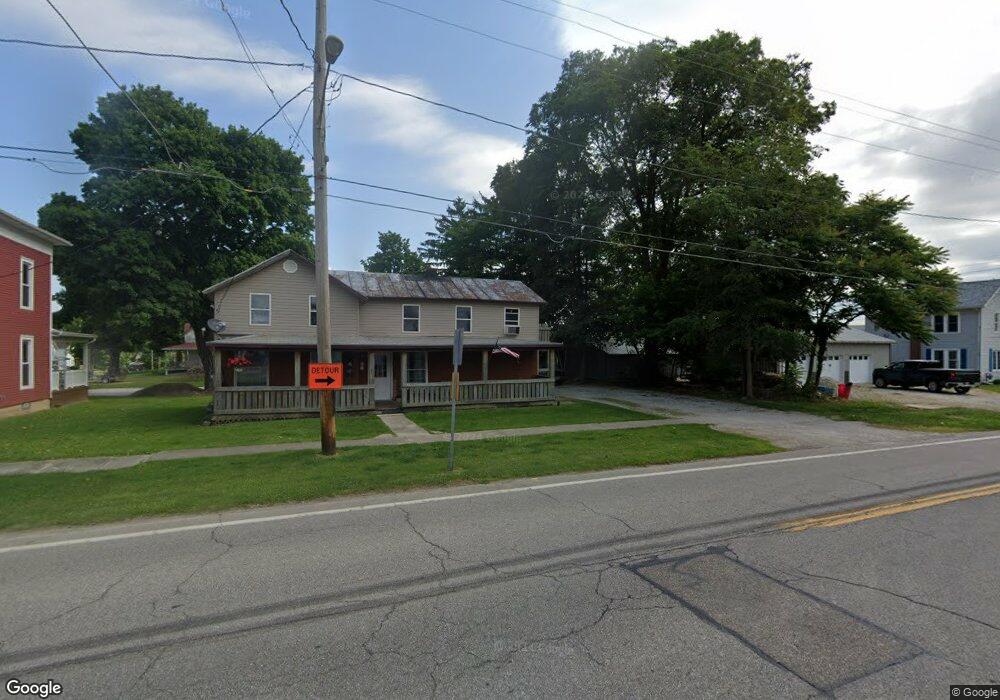
29 E Main St Shiloh, OH 44878
Estimated Value: $76,000 - $86,603
4
Beds
2
Baths
2,438
Sq Ft
$33/Sq Ft
Est. Value
About This Home
This home is located at 29 E Main St, Shiloh, OH 44878 and is currently estimated at $79,401, approximately $32 per square foot. 29 E Main St is a home located in Richland County with nearby schools including Shiloh Elementary School, Shiloh Middle School, and Plymouth High School.
Ownership History
Date
Name
Owned For
Owner Type
Purchase Details
Closed on
Aug 1, 2019
Sold by
Richman Travis L and Richman Linda A
Bought by
Jackson Crystal L
Current Estimated Value
Home Financials for this Owner
Home Financials are based on the most recent Mortgage that was taken out on this home.
Original Mortgage
$44,184
Outstanding Balance
$28,625
Interest Rate
3.62%
Mortgage Type
FHA
Estimated Equity
$50,776
Purchase Details
Closed on
Feb 18, 2016
Sold by
Fletcher Edgar and Fletcher Frances
Bought by
Richman Travis L and Richman Linda A
Purchase Details
Closed on
Aug 14, 2006
Sold by
Fletcher Edgar and Fletcher Frances
Bought by
Richman Travis L and Richman Linda A
Home Financials for this Owner
Home Financials are based on the most recent Mortgage that was taken out on this home.
Original Mortgage
$28,430
Interest Rate
8%
Mortgage Type
Seller Take Back
Purchase Details
Closed on
Sep 25, 2001
Sold by
Ryman Richard
Bought by
Fletcher Edgar and Fletcher Frances
Home Financials for this Owner
Home Financials are based on the most recent Mortgage that was taken out on this home.
Original Mortgage
$36,000
Interest Rate
7.06%
Mortgage Type
New Conventional
Purchase Details
Closed on
Feb 1, 1989
Create a Home Valuation Report for This Property
The Home Valuation Report is an in-depth analysis detailing your home's value as well as a comparison with similar homes in the area
Purchase History
| Date | Buyer | Sale Price | Title Company |
|---|---|---|---|
| Jackson Crystal L | $45,000 | None Available | |
| Richman Travis L | $33,425 | Attorney | |
| Richman Travis L | $33,430 | None Available | |
| Fletcher Edgar | $35,000 | -- | |
| -- | $20,000 | -- |
Source: Public Records
Mortgage History
| Date | Status | Borrower | Loan Amount |
|---|---|---|---|
| Open | Jackson Crystal L | $44,184 | |
| Previous Owner | Richman Travis L | $28,430 | |
| Previous Owner | Fletcher Edgar | $36,000 |
Source: Public Records
Tax History
| Year | Tax Paid | Tax Assessment Tax Assessment Total Assessment is a certain percentage of the fair market value that is determined by local assessors to be the total taxable value of land and additions on the property. | Land | Improvement |
|---|---|---|---|---|
| 2025 | $914 | $23,770 | $2,850 | $20,920 |
| 2024 | $914 | $23,770 | $2,850 | $20,920 |
| 2023 | $938 | $23,770 | $2,850 | $20,920 |
| 2022 | $705 | $15,500 | $2,960 | $12,540 |
| 2021 | $709 | $15,500 | $2,960 | $12,540 |
| 2020 | $742 | $15,500 | $2,960 | $12,540 |
| 2019 | $571 | $11,560 | $2,510 | $9,050 |
| 2018 | $568 | $11,560 | $2,510 | $9,050 |
| 2017 | $559 | $11,560 | $2,510 | $9,050 |
| 2016 | $608 | $13,150 | $2,510 | $10,640 |
| 2015 | $607 | $13,150 | $2,510 | $10,640 |
| 2014 | $616 | $13,150 | $2,510 | $10,640 |
| 2012 | $583 | $13,150 | $2,510 | $10,640 |
Source: Public Records
Map
Nearby Homes
- 49 North St
- 0 St Rt 61- Lot 2 Unit 9061433
- 134 E Main St
- 33 E Main St
- 60 Portner St
- 4273 Old State Rd
- 6247 State Route 61 N
- 199 Sandusky St
- 2 Plum Creek Meadows
- 412 Lattimer Rd W
- 245 Lincoln Ct
- 447 Ohio 603
- 1780 US Highway 224
- 0 Countryside Dr N
- 32 Elmwood Dr
- 3245 US Hwy 250 S
- 16 W Main St
- 34 Flint St
- 16 Senior Dr
- 159 Poplar Ave
Your Personal Tour Guide
Ask me questions while you tour the home.