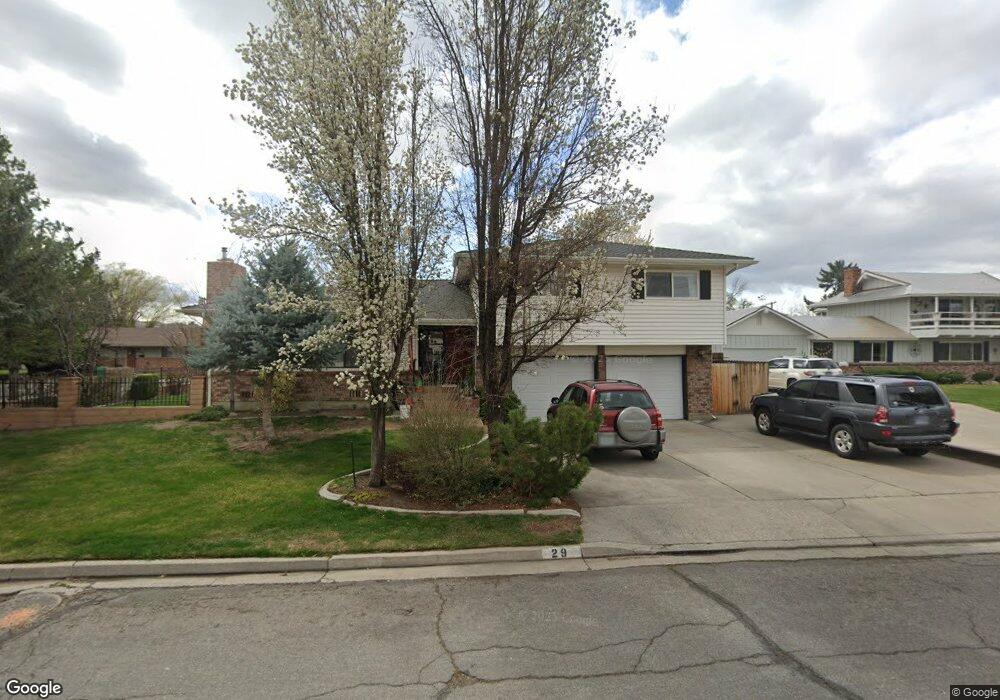
29 E Quail St Sparks, NV 89431
McCarran Boulevard-Probasco NeighborhoodEstimated Value: $496,390 - $536,000
3
Beds
3
Baths
2,424
Sq Ft
$216/Sq Ft
Est. Value
About This Home
This home is located at 29 E Quail St, Sparks, NV 89431 and is currently estimated at $523,348, approximately $215 per square foot. 29 E Quail St is a home located in Washoe County with nearby schools including Greenbrae Elementary School, George L Dilworth Middle School, and Sparks High School.
Ownership History
Date
Name
Owned For
Owner Type
Purchase Details
Closed on
Dec 17, 2020
Sold by
Belan Peter
Bought by
Belan Peter and Belan Xiao Qi
Current Estimated Value
Purchase Details
Closed on
Jul 6, 2016
Sold by
Belan Miloslav and Belan Julie
Bought by
Belan Miloslav
Purchase Details
Closed on
Dec 21, 2004
Sold by
Belan Miloslav and Belan Julie
Bought by
Belan Miloslav and Belan Julie
Purchase Details
Closed on
Jun 10, 2003
Sold by
Belan Peter
Bought by
Belan Miloslav and Belan Julie
Purchase Details
Closed on
Jun 14, 2002
Sold by
Ginsburg David A and Ginsburg Pamela J
Bought by
Belan Peter
Home Financials for this Owner
Home Financials are based on the most recent Mortgage that was taken out on this home.
Original Mortgage
$158,000
Outstanding Balance
$65,171
Interest Rate
6.74%
Estimated Equity
$458,177
Create a Home Valuation Report for This Property
The Home Valuation Report is an in-depth analysis detailing your home's value as well as a comparison with similar homes in the area
Home Values in the Area
Average Home Value in this Area
Purchase History
| Date | Buyer | Sale Price | Title Company |
|---|---|---|---|
| Belan Peter | -- | First Centennial Reno | |
| Belan Peter | -- | First Centennial Title Reno | |
| Belan Miloslav | -- | None Available | |
| Belan Miloslav | -- | -- | |
| Belan Miloslav | $173,760 | First Centennial Title Co | |
| Belan Peter | $188,000 | First Centennial Title Co |
Source: Public Records
Mortgage History
| Date | Status | Borrower | Loan Amount |
|---|---|---|---|
| Open | Belan Peter | $158,000 |
Source: Public Records
Tax History
| Year | Tax Paid | Tax Assessment Tax Assessment Total Assessment is a certain percentage of the fair market value that is determined by local assessors to be the total taxable value of land and additions on the property. | Land | Improvement |
|---|---|---|---|---|
| 2026 | -- | $68,172 | $36,540 | $31,632 |
| 2024 | $1,784 | $67,470 | $34,755 | $32,715 |
| 2023 | $1,733 | $66,900 | $34,930 | $31,970 |
| 2022 | $1,684 | $55,887 | $28,455 | $27,432 |
| 2021 | $1,635 | $47,754 | $19,635 | $28,119 |
| 2020 | $1,586 | $46,788 | $17,850 | $28,938 |
| 2019 | $1,540 | $47,297 | $18,725 | $28,572 |
| 2018 | $1,495 | $42,214 | $13,545 | $28,669 |
| 2017 | $1,451 | $41,403 | $12,075 | $29,328 |
| 2016 | $1,415 | $42,123 | $11,550 | $30,573 |
| 2015 | $1,413 | $40,896 | $9,415 | $31,481 |
| 2014 | $1,372 | $38,580 | $7,980 | $30,600 |
| 2013 | -- | $36,633 | $5,985 | $30,648 |
Source: Public Records
Map
Nearby Homes
- 8 E O St
- 14 E Greenbrae Dr
- 28 Arndell Way
- 115 P St
- 91 E York Way
- 31 E L St
- 136 York Way Unit 1
- 343 Richards Way
- 1940 4th St Unit 20
- 1940 4th St Unit 51
- 1940 4th St Unit 46
- 314 M St
- 1945 4th St Unit 33
- 1945 4th St Unit 22
- 1945 4th St Unit 51
- 355 York Way
- 370 O'Brien Way
- 11 E J St
- 1777 Howard Ct
- 2455 Coppa Way
Your Personal Tour Guide
Ask me questions while you tour the home.