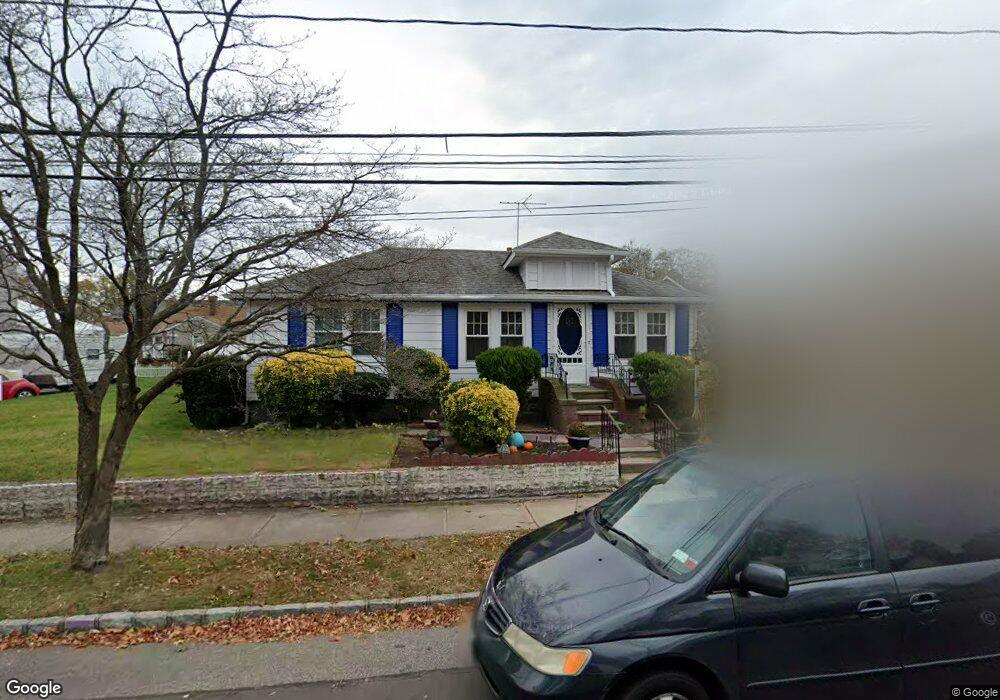
29 Easton St Lindenhurst, NY 11757
Estimated Value: $581,000 - $639,000
--
Bed
--
Bath
1,356
Sq Ft
$450/Sq Ft
Est. Value
About This Home
This home is located at 29 Easton St, Lindenhurst, NY 11757 and is currently estimated at $610,466, approximately $450 per square foot. 29 Easton St is a home located in Suffolk County with nearby schools including Daniel Street School, Lindenhurst Middle School, and Lindenhurst Senior High School.
Ownership History
Date
Name
Owned For
Owner Type
Purchase Details
Closed on
Aug 24, 2020
Sold by
Chivvis George A and Chivvis Evelyn
Bought by
Chivvis Floyd G
Current Estimated Value
Purchase Details
Closed on
Jul 7, 2009
Sold by
Randazzo Nannette and Renda Josephine
Bought by
Chivvis Evelyn
Purchase Details
Closed on
Jun 30, 1996
Sold by
Renda Andrea and Renda Josephine
Bought by
Renda Andrea and Renda Josephine
Purchase Details
Closed on
Jul 31, 1995
Sold by
Renda Andrea and Renda Josephine
Bought by
Renda Andrea and Renda Josephine
Create a Home Valuation Report for This Property
The Home Valuation Report is an in-depth analysis detailing your home's value as well as a comparison with similar homes in the area
Home Values in the Area
Average Home Value in this Area
Purchase History
| Date | Buyer | Sale Price | Title Company |
|---|---|---|---|
| Chivvis Floyd G | -- | None Available | |
| Chivvis Evelyn | $265,000 | -- | |
| Renda Andrea | -- | First American Title Ins Co | |
| Renda Andrea | -- | -- |
Source: Public Records
Tax History Compared to Growth
Tax History
| Year | Tax Paid | Tax Assessment Tax Assessment Total Assessment is a certain percentage of the fair market value that is determined by local assessors to be the total taxable value of land and additions on the property. | Land | Improvement |
|---|---|---|---|---|
| 2024 | $10,340 | $2,790 | $500 | $2,290 |
| 2023 | $9,429 | $2,790 | $500 | $2,290 |
| 2022 | $8,412 | $2,790 | $500 | $2,290 |
| 2021 | $8,412 | $2,790 | $500 | $2,290 |
| 2020 | $8,794 | $2,790 | $500 | $2,290 |
| 2019 | $9,605 | $0 | $0 | $0 |
| 2018 | $0 | $2,790 | $500 | $2,290 |
| 2017 | $8,372 | $2,790 | $500 | $2,290 |
| 2016 | $8,386 | $2,790 | $500 | $2,290 |
| 2015 | -- | $2,790 | $500 | $2,290 |
| 2014 | -- | $2,790 | $500 | $2,290 |
Source: Public Records
Map
Nearby Homes