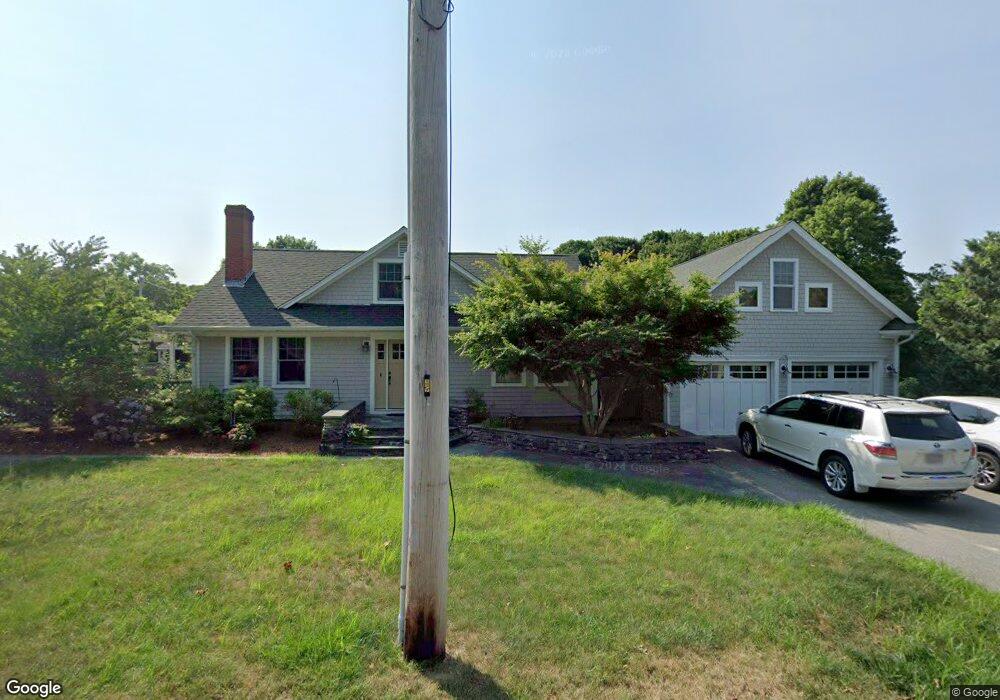
29 Elm Ave Bourne, MA 2532
Monument Beach NeighborhoodEstimated Value: $684,000 - $994,000
3
Beds
2
Baths
2,471
Sq Ft
$330/Sq Ft
Est. Value
About This Home
This home is located at 29 Elm Ave, Bourne, MA 2532 and is currently estimated at $814,509, approximately $329 per square foot. 29 Elm Ave is a home located in Barnstable County with nearby schools including Bourne High School, Cadence Academy Preschool - Bourne, and St Margaret Regional School.
Ownership History
Date
Name
Owned For
Owner Type
Purchase Details
Closed on
Apr 14, 2016
Sold by
Trask Tami M
Bought by
Good Michael W and Trask Tami M
Current Estimated Value
Home Financials for this Owner
Home Financials are based on the most recent Mortgage that was taken out on this home.
Original Mortgage
$266,000
Interest Rate
3.64%
Mortgage Type
New Conventional
Purchase Details
Closed on
Mar 18, 2004
Sold by
Philbrick Steven C
Bought by
Trask Tami M
Create a Home Valuation Report for This Property
The Home Valuation Report is an in-depth analysis detailing your home's value as well as a comparison with similar homes in the area
Home Values in the Area
Average Home Value in this Area
Purchase History
| Date | Buyer | Sale Price | Title Company |
|---|---|---|---|
| Good Michael W | -- | -- | |
| Good Michael W | -- | -- | |
| Trask Tami M | $292,000 | -- | |
| Trask Tami M | $292,000 | -- |
Source: Public Records
Mortgage History
| Date | Status | Borrower | Loan Amount |
|---|---|---|---|
| Closed | Good Michael W | $266,000 | |
| Previous Owner | Trask Tami M | $139,000 |
Source: Public Records
Tax History
| Year | Tax Paid | Tax Assessment Tax Assessment Total Assessment is a certain percentage of the fair market value that is determined by local assessors to be the total taxable value of land and additions on the property. | Land | Improvement |
|---|---|---|---|---|
| 2025 | $6,474 | $828,900 | $234,800 | $594,100 |
| 2024 | $6,330 | $789,300 | $223,600 | $565,700 |
| 2023 | $5,424 | $615,700 | $197,900 | $417,800 |
| 2022 | $5,180 | $513,400 | $175,100 | $338,300 |
| 2021 | $5,049 | $468,800 | $159,400 | $309,400 |
| 2020 | $5,071 | $472,200 | $157,900 | $314,300 |
| 2019 | $4,641 | $441,600 | $144,100 | $297,500 |
| 2018 | $4,441 | $421,300 | $137,300 | $284,000 |
| 2017 | $4,296 | $417,100 | $136,000 | $281,100 |
| 2016 | $3,437 | $338,300 | $136,000 | $202,300 |
| 2015 | $2,809 | $278,900 | $136,000 | $142,900 |
Source: Public Records
Map
Nearby Homes
- 203 County Rd
- 566 Shore Rd
- 16 Amberwood Ct
- 13 Laurel Hill Ct
- 12 Turnberry Rd Unit 12
- 4 Harbor Hill Dr
- 35 Benedict Rd
- 5 Sea Knoll Ct
- 20 Colony Ave
- 5 Zoli Ln
- 4 Hollyhock Knoll Ct Unit 4
- 4 Hollyhock Knoll Ct Unit 4
- 14 Navajo Rd
- 44 Cotuit Rd
- 60 Bourne Neck Dr
- 709 County Rd
- 3 1st St
- 254 Barlows Landing Rd
- 60 Sandwich Rd
- 10 Sandy Ln
Your Personal Tour Guide
Ask me questions while you tour the home.