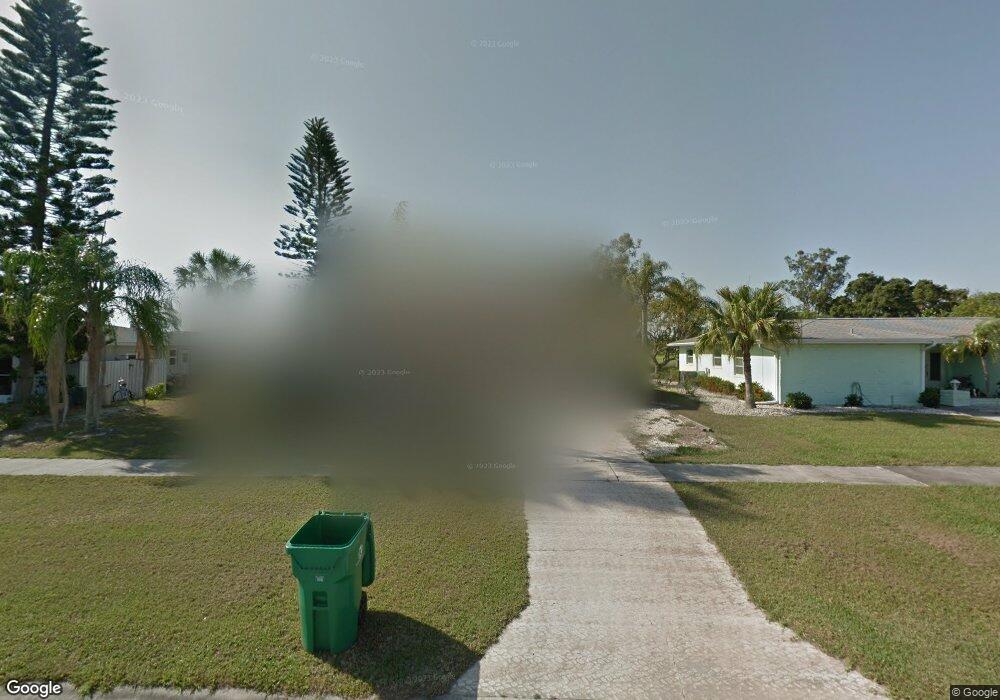
29 Elm Dr Rotonda West, FL 34946
Estimated Value: $381,617 - $565,000
4
Beds
2
Baths
2,121
Sq Ft
$220/Sq Ft
Est. Value
About This Home
This home is located at 29 Elm Dr, Rotonda West, FL 34946 and is currently estimated at $467,654, approximately $220 per square foot. 29 Elm Dr is a home located in Charlotte County with nearby schools including Myakka River Elementary School, L.A. Ainger Middle School, and Lemon Bay High School.
Ownership History
Date
Name
Owned For
Owner Type
Purchase Details
Closed on
Jul 22, 2022
Sold by
Giraldi Joseph L
Bought by
Owings David
Current Estimated Value
Home Financials for this Owner
Home Financials are based on the most recent Mortgage that was taken out on this home.
Original Mortgage
$260,000
Outstanding Balance
$248,833
Interest Rate
5.81%
Mortgage Type
Seller Take Back
Estimated Equity
$218,821
Purchase Details
Closed on
Feb 22, 2017
Sold by
U S Bank Na
Bought by
Giraldi Joseph
Purchase Details
Closed on
Dec 12, 2016
Sold by
Powers Lee A and Powers Sharon
Bought by
U S Bank National Association
Purchase Details
Closed on
Feb 22, 2007
Sold by
Wise Marie B
Bought by
Powers Lee A and Powers Sharon
Home Financials for this Owner
Home Financials are based on the most recent Mortgage that was taken out on this home.
Original Mortgage
$152,000
Interest Rate
6.19%
Mortgage Type
Purchase Money Mortgage
Create a Home Valuation Report for This Property
The Home Valuation Report is an in-depth analysis detailing your home's value as well as a comparison with similar homes in the area
Home Values in the Area
Average Home Value in this Area
Purchase History
| Date | Buyer | Sale Price | Title Company |
|---|---|---|---|
| Owings David | $325,000 | Glantz & Glantz Pa | |
| Giraldi Joseph | $126,500 | Service Link Llc | |
| U S Bank National Association | $64,300 | None Available | |
| Powers Lee A | $190,000 | Cps Title Llc |
Source: Public Records
Mortgage History
| Date | Status | Borrower | Loan Amount |
|---|---|---|---|
| Open | Owings David | $260,000 | |
| Previous Owner | Powers Lee A | $152,000 |
Source: Public Records
Tax History Compared to Growth
Tax History
| Year | Tax Paid | Tax Assessment Tax Assessment Total Assessment is a certain percentage of the fair market value that is determined by local assessors to be the total taxable value of land and additions on the property. | Land | Improvement |
|---|---|---|---|---|
| 2023 | $5,538 | $275,548 | $15,300 | $260,248 |
| 2022 | $4,636 | $270,151 | $13,600 | $256,551 |
| 2021 | $3,918 | $170,112 | $4,590 | $165,522 |
| 2020 | $3,664 | $164,614 | $4,080 | $160,534 |
| 2019 | $3,639 | $164,896 | $3,825 | $161,071 |
| 2018 | $3,456 | $164,658 | $4,250 | $160,408 |
| 2017 | $3,381 | $157,837 | $4,250 | $153,587 |
| 2016 | $3,500 | $162,007 | $0 | $0 |
| 2015 | $3,411 | $151,834 | $0 | $0 |
| 2014 | $3,235 | $138,031 | $0 | $0 |
Source: Public Records
Map
Nearby Homes