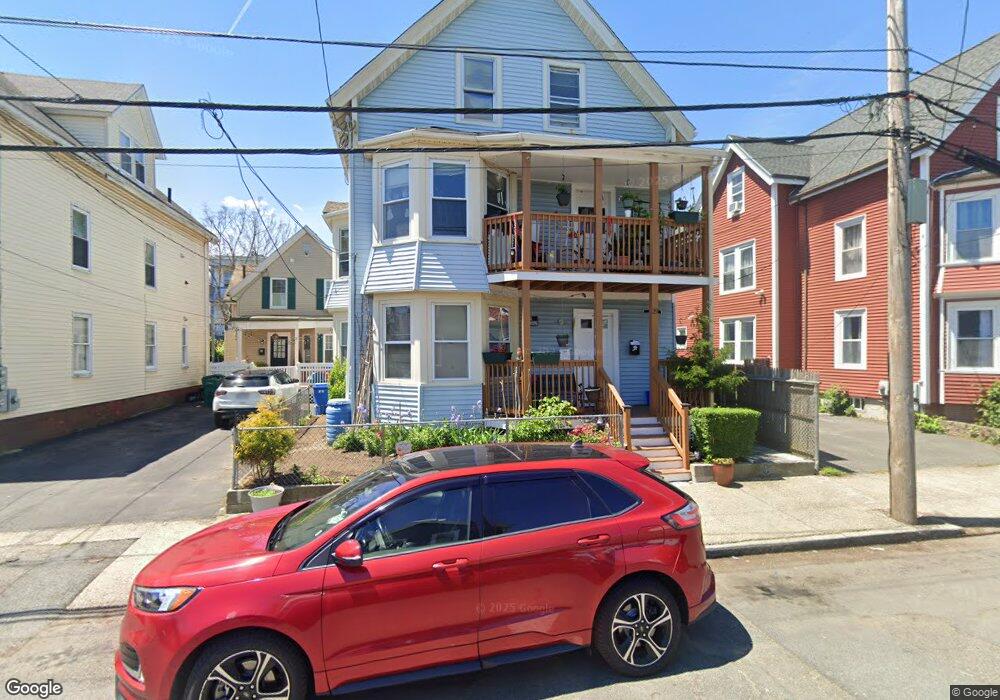
29 Elm St Lynn, MA 01905
West Lynn NeighborhoodEstimated Value: $652,000 - $750,746
6
Beds
2
Baths
2,915
Sq Ft
$238/Sq Ft
Est. Value
About This Home
This home is located at 29 Elm St, Lynn, MA 01905 and is currently estimated at $692,687, approximately $237 per square foot. 29 Elm St is a home located in Essex County with nearby schools including Cokato Elementary School, William P Connery Elementary School, and North Park Elementary School.
Ownership History
Date
Name
Owned For
Owner Type
Purchase Details
Closed on
Feb 28, 2001
Sold by
Lao Henglay and Khuon Maly
Bought by
Ortega Felipe and Ortega Maria
Current Estimated Value
Home Financials for this Owner
Home Financials are based on the most recent Mortgage that was taken out on this home.
Original Mortgage
$177,200
Interest Rate
7%
Mortgage Type
Purchase Money Mortgage
Purchase Details
Closed on
Nov 7, 1997
Sold by
Riihimaki Robert I and Riihimaki Kathleen
Bought by
Lao Henglay
Create a Home Valuation Report for This Property
The Home Valuation Report is an in-depth analysis detailing your home's value as well as a comparison with similar homes in the area
Home Values in the Area
Average Home Value in this Area
Purchase History
| Date | Buyer | Sale Price | Title Company |
|---|---|---|---|
| Ortega Felipe | $180,000 | -- | |
| Ortega Felipe | $180,000 | -- | |
| Lao Henglay | $82,000 | -- | |
| Lao Henglay | $82,000 | -- |
Source: Public Records
Mortgage History
| Date | Status | Borrower | Loan Amount |
|---|---|---|---|
| Open | Lao Henglay | $330,000 | |
| Closed | Lao Henglay | $228,000 | |
| Closed | Lao Henglay | $177,200 |
Source: Public Records
Tax History Compared to Growth
Tax History
| Year | Tax Paid | Tax Assessment Tax Assessment Total Assessment is a certain percentage of the fair market value that is determined by local assessors to be the total taxable value of land and additions on the property. | Land | Improvement |
|---|---|---|---|---|
| 2025 | $7,806 | $753,442 | $191,800 | $561,642 |
| 2024 | $7,322 | $695,300 | $176,200 | $519,100 |
| 2023 | $7,127 | $639,200 | $157,000 | $482,200 |
| 2022 | $7,382 | $593,900 | $147,500 | $446,400 |
| 2021 | $6,756 | $518,500 | $121,700 | $396,800 |
| 2020 | $6,081 | $453,800 | $101,600 | $352,200 |
| 2019 | $5,756 | $402,500 | $87,300 | $315,200 |
| 2018 | $5,456 | $360,100 | $95,500 | $264,600 |
| 2017 | $5,209 | $333,900 | $84,400 | $249,500 |
| 2016 | $4,848 | $299,600 | $79,900 | $219,700 |
| 2015 | $4,410 | $263,300 | $68,900 | $194,400 |
Source: Public Records
Map
Nearby Homes
- 103 Warren St
- 93 South St
- 27 S Street Ct
- 693 Western Ave Unit 101
- 39 Centre St
- 662-664 Western Ave
- 15 Neptune Street Ct
- 19 Hood St
- 20 Huss Ct Unit 105
- 140 S Common St
- 20 Murray St
- 121 N Common St
- 45 Cottage St Unit 3
- 10 Carnes St
- 66 Harwood St
- 447 Boston St
- 16 Linden St
- 505-507 Boston St
- 43 Baker St
- 69 N Common St