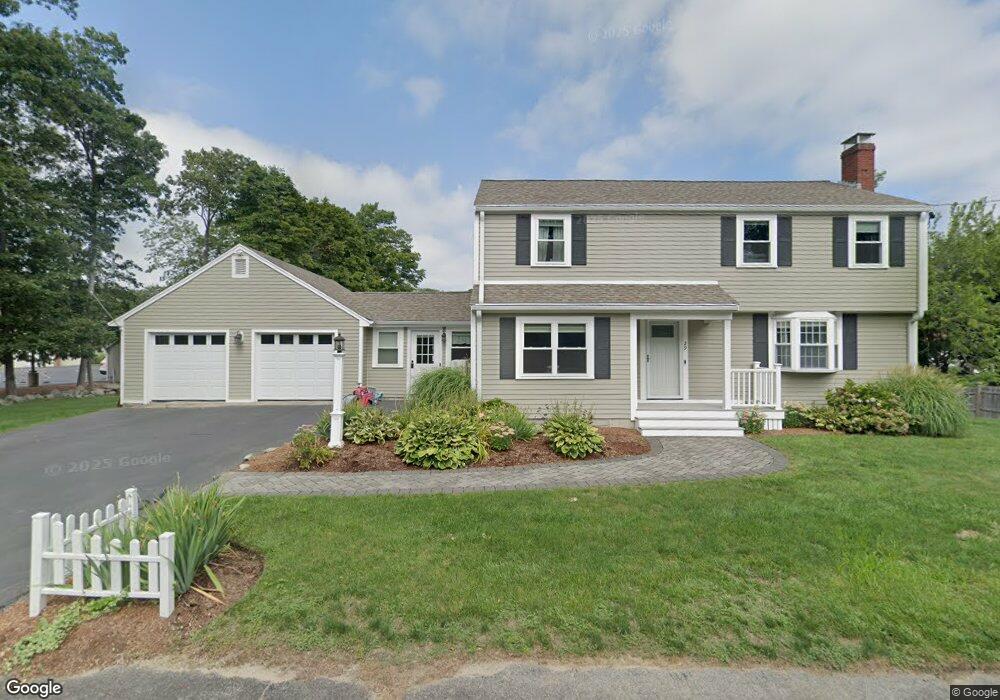
29 Estabrook Rd Weymouth, MA 02188
Weymouth Landing NeighborhoodEstimated Value: $643,273
4
Beds
2
Baths
1,812
Sq Ft
$355/Sq Ft
Est. Value
About This Home
This home is located at 29 Estabrook Rd, Weymouth, MA 02188 and is currently estimated at $643,273, approximately $355 per square foot. 29 Estabrook Rd is a home located in Norfolk County with nearby schools including Academy Avenue Elementary School, Abigail Adams Middle School, and Weymouth Middle School Chapman.
Ownership History
Date
Name
Owned For
Owner Type
Purchase Details
Closed on
Jun 14, 2017
Sold by
Buttafuocoorazio Z Est
Bought by
Crossroads Worship Cen
Current Estimated Value
Purchase Details
Closed on
Jun 24, 1980
Bought by
Buttafuoco Orazio Z
Create a Home Valuation Report for This Property
The Home Valuation Report is an in-depth analysis detailing your home's value as well as a comparison with similar homes in the area
Home Values in the Area
Average Home Value in this Area
Purchase History
| Date | Buyer | Sale Price | Title Company |
|---|---|---|---|
| Crossroads Worship Cen | $375,000 | -- | |
| Buttafuoco Orazio Z | -- | -- |
Source: Public Records
Mortgage History
| Date | Status | Borrower | Loan Amount |
|---|---|---|---|
| Previous Owner | Buttafuoco Orazio Z | $65,000 | |
| Previous Owner | Buttafuoco Orazio Z | $17,400 | |
| Previous Owner | Buttafuoco Orazio Z | $25,000 |
Source: Public Records
Tax History
| Year | Tax Paid | Tax Assessment Tax Assessment Total Assessment is a certain percentage of the fair market value that is determined by local assessors to be the total taxable value of land and additions on the property. | Land | Improvement |
|---|---|---|---|---|
| 2025 | $0 | $618,200 | $243,100 | $375,100 |
| 2024 | $0 | $595,600 | $231,600 | $364,000 |
| 2023 | $0 | $560,600 | $214,400 | $346,200 |
| 2022 | $0 | $502,700 | $198,500 | $304,200 |
| 2021 | $0 | $474,500 | $198,500 | $276,000 |
| 2020 | $0 | $455,500 | $198,500 | $257,000 |
| 2019 | $0 | $437,100 | $190,900 | $246,200 |
| 2018 | $0 | $410,200 | $181,800 | $228,400 |
| 2017 | $4,941 | $385,700 | $173,200 | $212,500 |
| 2016 | $4,788 | $374,100 | $166,500 | $207,600 |
| 2015 | $4,574 | $354,600 | $158,900 | $195,700 |
| 2014 | $4,424 | $332,600 | $147,900 | $184,700 |
Source: Public Records
Map
Nearby Homes
- 46 Roosevelt Rd
- 19 Vine St Unit 3
- 19 Vine St Unit 2
- 211 Roosevelt Rd
- 25 Richmond St
- 33 Congress St
- 11 Richmond St
- 49 Cornish St
- 122 Washington St Unit Twenty-two
- 29-31 Broad Street Place
- 15 Summer St
- 270 Middle St
- 116 Greenvale Ave
- 107 Summer St
- 78 Middle St
- 148 Chard St
- 70 Biscayne Ave
- 209 Lake St Unit 65
- 573 Broad St Unit 325
- 67 Charles St
Your Personal Tour Guide
Ask me questions while you tour the home.