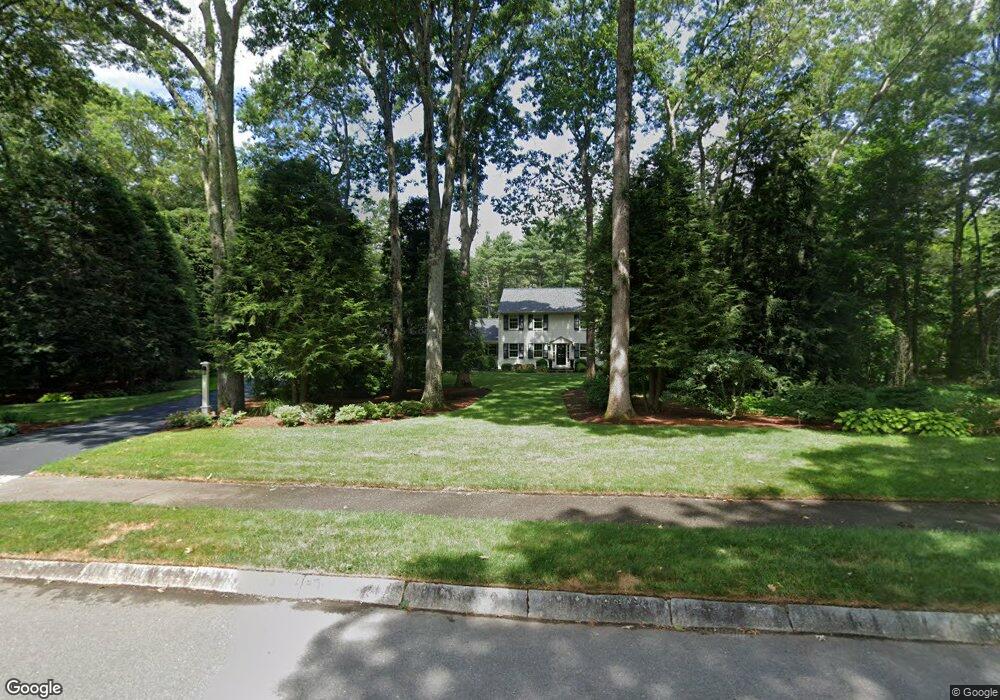
29 Fairway Ln Foxboro, MA 02035
Estimated Value: $911,829 - $965,000
4
Beds
3
Baths
2,768
Sq Ft
$342/Sq Ft
Est. Value
About This Home
This home is located at 29 Fairway Ln, Foxboro, MA 02035 and is currently estimated at $947,957, approximately $342 per square foot. 29 Fairway Ln is a home located in Norfolk County with nearby schools including Foxborough High School, Foxborough Regional Charter School, and Hands-On-Montessori School.
Ownership History
Date
Name
Owned For
Owner Type
Purchase Details
Closed on
Jul 27, 2007
Sold by
Buben Mary
Bought by
Thrasher Scott T and Thrasher Jayne E
Current Estimated Value
Home Financials for this Owner
Home Financials are based on the most recent Mortgage that was taken out on this home.
Original Mortgage
$380,000
Outstanding Balance
$242,068
Interest Rate
6.78%
Mortgage Type
Purchase Money Mortgage
Estimated Equity
$705,889
Create a Home Valuation Report for This Property
The Home Valuation Report is an in-depth analysis detailing your home's value as well as a comparison with similar homes in the area
Home Values in the Area
Average Home Value in this Area
Purchase History
| Date | Buyer | Sale Price | Title Company |
|---|---|---|---|
| Thrasher Scott T | $475,000 | -- |
Source: Public Records
Mortgage History
| Date | Status | Borrower | Loan Amount |
|---|---|---|---|
| Open | Thrasher Scott T | $380,000 | |
| Closed | Thrasher Scott T | $47,500 |
Source: Public Records
Tax History
| Year | Tax Paid | Tax Assessment Tax Assessment Total Assessment is a certain percentage of the fair market value that is determined by local assessors to be the total taxable value of land and additions on the property. | Land | Improvement |
|---|---|---|---|---|
| 2025 | $11,267 | $852,300 | $308,900 | $543,400 |
| 2024 | $10,958 | $811,100 | $308,200 | $502,900 |
| 2023 | $10,498 | $738,800 | $293,900 | $444,900 |
| 2022 | $9,683 | $666,900 | $241,500 | $425,400 |
| 2021 | $9,616 | $652,400 | $235,000 | $417,400 |
| 2020 | $9,303 | $638,500 | $235,000 | $403,500 |
| 2019 | $9,120 | $620,400 | $244,700 | $375,700 |
| 2018 | $8,856 | $607,800 | $244,700 | $363,100 |
| 2017 | $8,686 | $577,500 | $238,700 | $338,800 |
| 2016 | $8,206 | $553,700 | $210,700 | $343,000 |
| 2015 | $8,131 | $535,300 | $174,800 | $360,500 |
| 2014 | $7,849 | $523,600 | $170,100 | $353,500 |
Source: Public Records
Map
Nearby Homes
- 346 South St
- 155 South St
- 233 Central St
- 157 Central St
- 67 Carpenter St
- 356 Central St
- 1769 West St
- 13 Summerville Rd Unit 13
- 14 Baker St
- 54 Main St Unit A
- 26 Fuller Rd Unit 6
- 166 Chauncy St
- 128 Tremont St
- 40 Treasure Island Rd
- 16 Treasure Island Rd
- 483 Thurston St
- 619 N Main St
- 150 Rumford Ave Unit 110
- 165 Chestnut St Unit 2
- 266 N Main St Unit 3
Your Personal Tour Guide
Ask me questions while you tour the home.