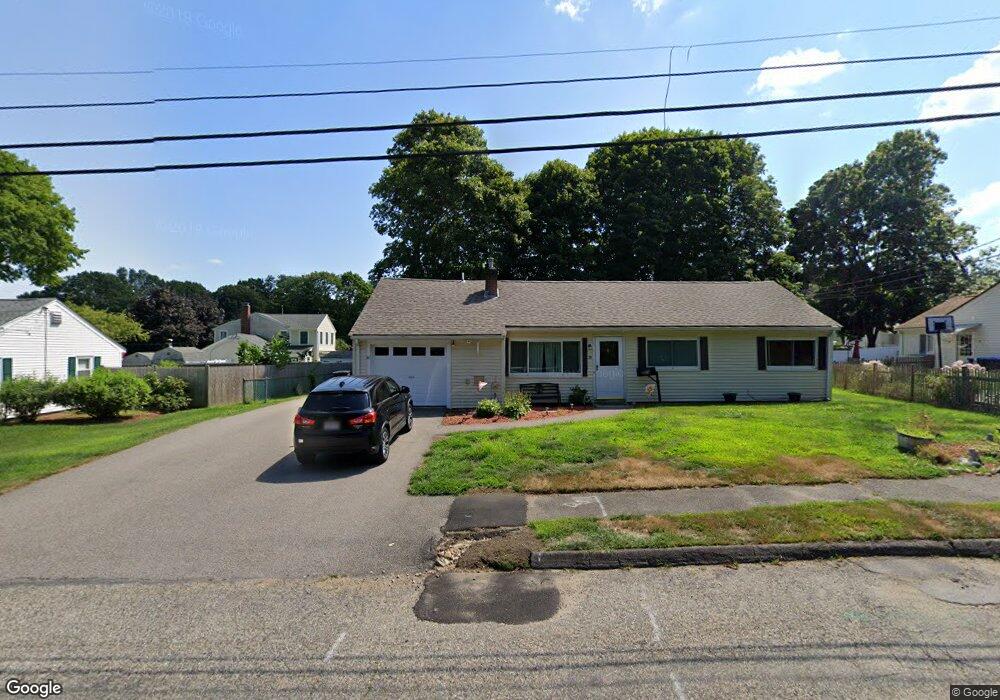
29 Felch Rd Natick, MA 01760
Estimated Value: $811,000 - $875,000
3
Beds
1
Bath
1,628
Sq Ft
$518/Sq Ft
Est. Value
About This Home
This home is located at 29 Felch Rd, Natick, MA 01760 and is currently estimated at $844,005, approximately $518 per square foot. 29 Felch Rd is a home located in Middlesex County with nearby schools including Natick High School, Bennett-Hemenway (Ben-Hem) Elementary School, and Wilson Middle School.
Ownership History
Date
Name
Owned For
Owner Type
Purchase Details
Closed on
Jun 7, 2019
Sold by
Karlen Richard B and Karlen Jennifer
Bought by
Karlen Richard B and Karlen Scott M
Current Estimated Value
Home Financials for this Owner
Home Financials are based on the most recent Mortgage that was taken out on this home.
Original Mortgage
$342,300
Outstanding Balance
$300,965
Interest Rate
4.1%
Mortgage Type
Adjustable Rate Mortgage/ARM
Estimated Equity
$543,040
Purchase Details
Closed on
Dec 6, 2016
Sold by
Karlen Richard B
Bought by
Karlen Richard B and Karlen Jennifer
Purchase Details
Closed on
Apr 5, 2005
Sold by
Ingham Jennifer A and Sullivan Jennifer A
Bought by
Karlen Richard B
Home Financials for this Owner
Home Financials are based on the most recent Mortgage that was taken out on this home.
Original Mortgage
$140,000
Interest Rate
5.61%
Mortgage Type
Purchase Money Mortgage
Purchase Details
Closed on
Jul 6, 2004
Sold by
Sullivan Wayne K
Bought by
Ingham Jennifer A and Sullivan Jennifer A
Purchase Details
Closed on
Jun 30, 2000
Sold by
Ingham Anne M
Bought by
Sullivan Wayne K and Sullivan Jennifer A
Home Financials for this Owner
Home Financials are based on the most recent Mortgage that was taken out on this home.
Original Mortgage
$60,000
Interest Rate
8.59%
Mortgage Type
Purchase Money Mortgage
Create a Home Valuation Report for This Property
The Home Valuation Report is an in-depth analysis detailing your home's value as well as a comparison with similar homes in the area
Home Values in the Area
Average Home Value in this Area
Purchase History
| Date | Buyer | Sale Price | Title Company |
|---|---|---|---|
| Karlen Richard B | -- | -- | |
| Karlen Richard B | -- | -- | |
| Karlen Richard B | $80,000 | -- | |
| Ingham Jennifer A | -- | -- | |
| Sullivan Wayne K | $80,000 | -- |
Source: Public Records
Mortgage History
| Date | Status | Borrower | Loan Amount |
|---|---|---|---|
| Open | Karlen Richard B | $342,300 | |
| Previous Owner | Sullivan Wayne K | $35,000 | |
| Previous Owner | Karlen Richard B | $140,000 | |
| Previous Owner | Sullivan Wayne K | $25,000 | |
| Previous Owner | Sullivan Wayne K | $60,000 |
Source: Public Records
Tax History
| Year | Tax Paid | Tax Assessment Tax Assessment Total Assessment is a certain percentage of the fair market value that is determined by local assessors to be the total taxable value of land and additions on the property. | Land | Improvement |
|---|---|---|---|---|
| 2025 | $7,516 | $628,400 | $425,400 | $203,000 |
| 2024 | $7,236 | $590,200 | $400,300 | $189,900 |
| 2023 | $7,166 | $566,900 | $385,300 | $181,600 |
| 2022 | $6,849 | $513,400 | $350,200 | $163,200 |
| 2021 | $6,576 | $483,200 | $330,200 | $153,000 |
| 2020 | $6,372 | $468,200 | $315,200 | $153,000 |
| 2019 | $5,951 | $468,200 | $315,200 | $153,000 |
| 2018 | $5,208 | $399,100 | $300,200 | $98,900 |
| 2017 | $8,044 | $352,400 | $255,300 | $97,100 |
| 2016 | $4,485 | $330,500 | $234,300 | $96,200 |
| 2015 | $4,458 | $322,600 | $234,300 | $88,300 |
Source: Public Records
Map
Nearby Homes
- 14 Drury Ln
- 278 N Main St
- 6 Cypress Rd
- 50 Wethersfield Rd
- 48 Wethersfield Rd
- 5 Bradford Rd
- 340 N Main St
- 4 Richard Rd
- 6 Ash St
- 1 Richard Rd
- 29 Irving Rd
- 8 Liberty St
- 25 Irving Rd
- 136 Commonwealth Rd
- 20 Wheeler Ln
- 78 E Plain St
- 13 Shawmut Avenue Extension
- 45 W Plain St Unit 1
- 8 Arlington Cir
- 186 Main St
Your Personal Tour Guide
Ask me questions while you tour the home.