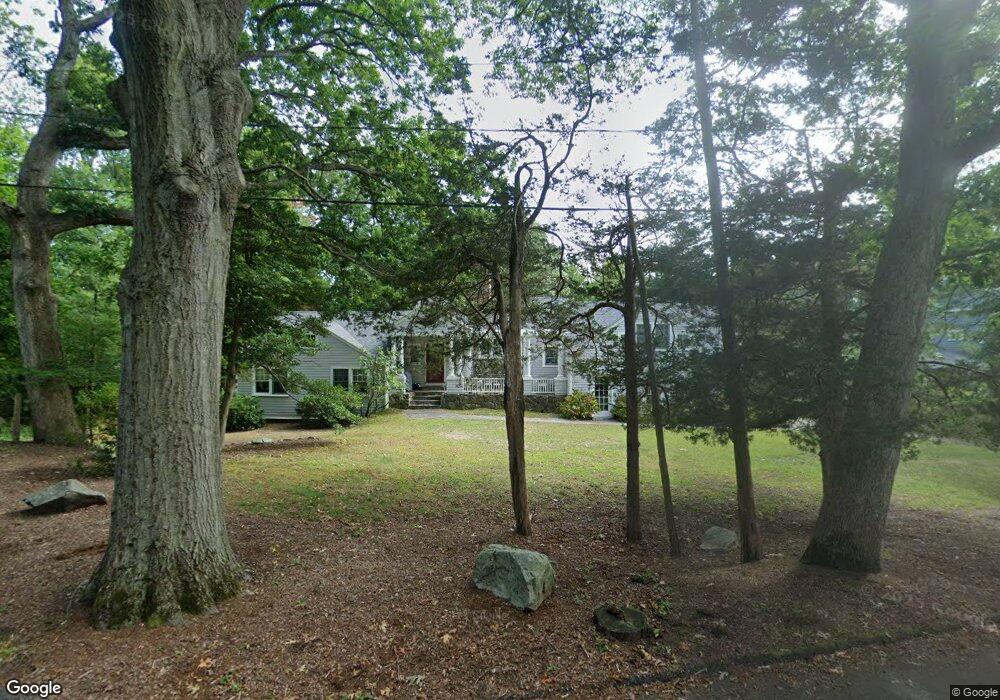
29 Fernway Cohasset, MA 02025
Estimated Value: $1,352,000 - $1,685,000
3
Beds
2
Baths
1,611
Sq Ft
$905/Sq Ft
Est. Value
About This Home
This home is located at 29 Fernway, Cohasset, MA 02025 and is currently estimated at $1,457,699, approximately $904 per square foot. 29 Fernway is a home located in Norfolk County with nearby schools including Joseph Osgood School, Deer Hill School, and Cohasset Middle School.
Ownership History
Date
Name
Owned For
Owner Type
Purchase Details
Closed on
Jan 16, 1997
Sold by
Ketcham Frank D
Bought by
Mcgowan William B and Mcgowan Molly S
Current Estimated Value
Home Financials for this Owner
Home Financials are based on the most recent Mortgage that was taken out on this home.
Original Mortgage
$170,000
Interest Rate
7.36%
Mortgage Type
Purchase Money Mortgage
Create a Home Valuation Report for This Property
The Home Valuation Report is an in-depth analysis detailing your home's value as well as a comparison with similar homes in the area
Home Values in the Area
Average Home Value in this Area
Purchase History
| Date | Buyer | Sale Price | Title Company |
|---|---|---|---|
| Mcgowan William B | $292,500 | -- | |
| Mcgowan William B | $292,500 | -- |
Source: Public Records
Mortgage History
| Date | Status | Borrower | Loan Amount |
|---|---|---|---|
| Open | Mcgowan William B | $345,000 | |
| Closed | Mcgowan William B | $165,000 | |
| Closed | Mcgowan William B | $170,000 |
Source: Public Records
Tax History Compared to Growth
Tax History
| Year | Tax Paid | Tax Assessment Tax Assessment Total Assessment is a certain percentage of the fair market value that is determined by local assessors to be the total taxable value of land and additions on the property. | Land | Improvement |
|---|---|---|---|---|
| 2025 | $13,344 | $1,152,300 | $654,400 | $497,900 |
| 2024 | $9,988 | $820,700 | $545,400 | $275,300 |
| 2023 | $7,897 | $669,200 | $393,900 | $275,300 |
| 2022 | $8,016 | $638,200 | $393,900 | $244,300 |
| 2021 | $8,137 | $624,000 | $393,900 | $230,100 |
| 2020 | $8,093 | $624,000 | $393,900 | $230,100 |
| 2019 | $7,577 | $587,400 | $357,300 | $230,100 |
| 2018 | $7,513 | $587,400 | $357,300 | $230,100 |
| 2017 | $7,393 | $566,100 | $324,800 | $241,300 |
| 2016 | $7,291 | $566,100 | $324,800 | $241,300 |
| 2015 | $7,195 | $566,100 | $324,800 | $241,300 |
| 2014 | $7,099 | $566,100 | $324,800 | $241,300 |
Source: Public Records
Map
Nearby Homes
- 146 N Main St Unit 146
- 25 Ripley Rd
- 296 N Main St
- 29 Heather Dr
- 11 Beach St
- 89 Ripley Rd
- 101 Nichols Rd
- 15 Cushing Rd
- 135 Beach St
- 119 Pleasant St
- 137 Fairoaks Ln
- 247 Forest Ave
- 356 Atlantic Ave
- 78 Old Pasture Rd
- 17 Mohawk Way
- 25 Mohawk Way
- 152 Forest Ave
- 128 Elm St Unit 211
- 26 Ash St
- 31 Chittenden Ln Unit 31