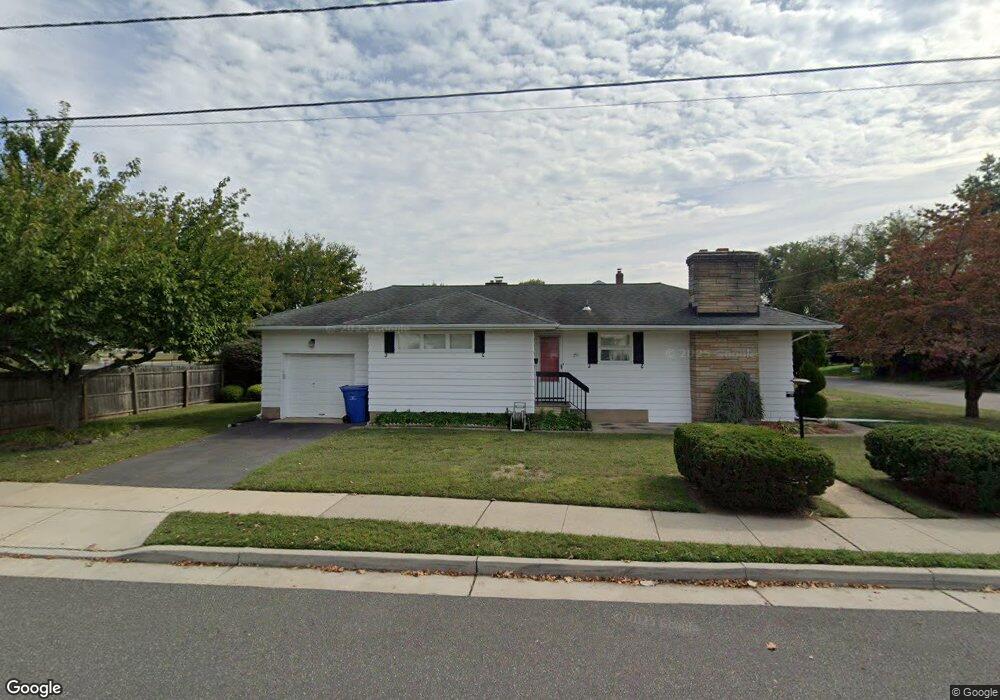
29 Fisher Ave Middlesex, NJ 08846
Estimated Value: $408,000 - $486,000
2
Beds
1
Bath
988
Sq Ft
$454/Sq Ft
Est. Value
About This Home
This home is located at 29 Fisher Ave, Middlesex, NJ 08846 and is currently estimated at $448,643, approximately $454 per square foot. 29 Fisher Ave is a home located in Middlesex County with nearby schools including Middlesex High School and Our Lady of Mount Virgin School.
Ownership History
Date
Name
Owned For
Owner Type
Purchase Details
Closed on
Apr 5, 2010
Sold by
Lupo Vincent F and Lupo Linda
Bought by
Lupo Vincent F and Lupo Linda
Current Estimated Value
Purchase Details
Closed on
Jul 15, 2005
Sold by
Lukacs Olga
Bought by
Tilmont Craig
Home Financials for this Owner
Home Financials are based on the most recent Mortgage that was taken out on this home.
Original Mortgage
$223,200
Outstanding Balance
$116,664
Interest Rate
5.68%
Estimated Equity
$331,979
Create a Home Valuation Report for This Property
The Home Valuation Report is an in-depth analysis detailing your home's value as well as a comparison with similar homes in the area
Home Values in the Area
Average Home Value in this Area
Purchase History
| Date | Buyer | Sale Price | Title Company |
|---|---|---|---|
| Lupo Vincent F | -- | None Available | |
| Tilmont Craig | $279,000 | -- |
Source: Public Records
Mortgage History
| Date | Status | Borrower | Loan Amount |
|---|---|---|---|
| Open | Tilmont Craig | $223,200 |
Source: Public Records
Tax History Compared to Growth
Tax History
| Year | Tax Paid | Tax Assessment Tax Assessment Total Assessment is a certain percentage of the fair market value that is determined by local assessors to be the total taxable value of land and additions on the property. | Land | Improvement |
|---|---|---|---|---|
| 2025 | $7,645 | $406,900 | $144,800 | $262,100 |
| 2024 | $7,279 | $330,400 | $144,800 | $185,600 |
| 2023 | $7,279 | $330,400 | $144,800 | $185,600 |
| 2022 | $7,092 | $71,700 | $22,500 | $49,200 |
| 2021 | $5,144 | $71,700 | $22,500 | $49,200 |
| 2020 | $6,756 | $71,700 | $22,500 | $49,200 |
| 2019 | $6,573 | $71,700 | $22,500 | $49,200 |
| 2018 | $6,373 | $71,700 | $22,500 | $49,200 |
| 2017 | $6,198 | $71,700 | $22,500 | $49,200 |
| 2016 | $5,993 | $71,700 | $22,500 | $49,200 |
| 2015 | $5,866 | $71,700 | $22,500 | $49,200 |
| 2014 | $5,755 | $71,700 | $22,500 | $49,200 |
Source: Public Records
Map
Nearby Homes