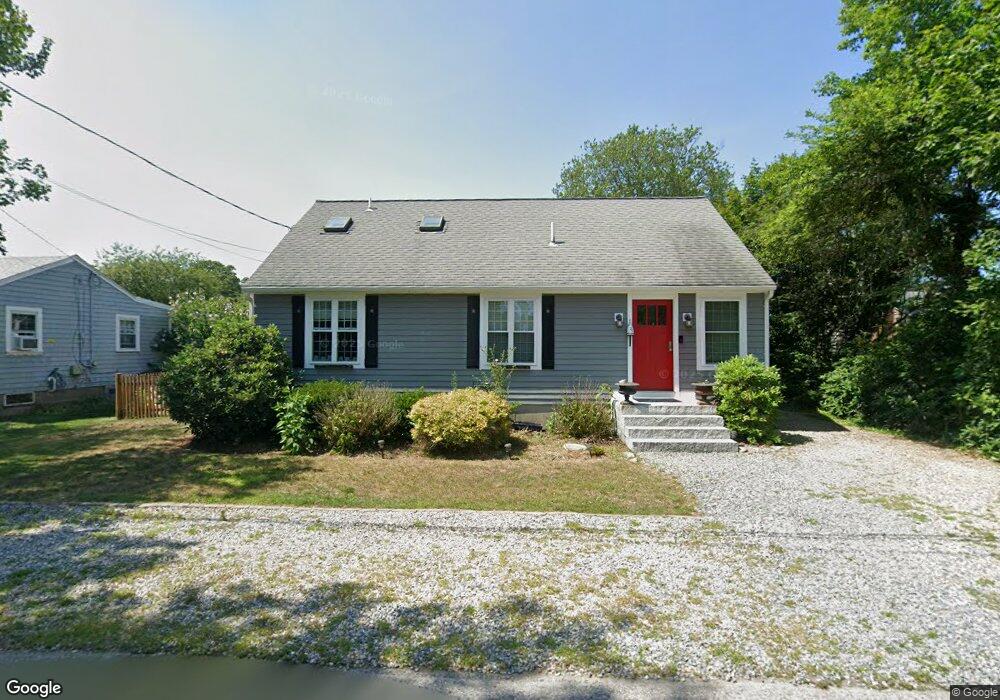
29 Ford St Unit 1 Marshfield, MA 02050
Ocean Bluff-Brant Rock NeighborhoodEstimated Value: $675,000 - $810,000
3
Beds
1
Bath
1,482
Sq Ft
$509/Sq Ft
Est. Value
About This Home
This home is located at 29 Ford St Unit 1, Marshfield, MA 02050 and is currently estimated at $753,935, approximately $508 per square foot. 29 Ford St Unit 1 is a home located in Plymouth County with nearby schools including Daniel Webster, Furnace Brook Middle School, and Marshfield High School.
Ownership History
Date
Name
Owned For
Owner Type
Purchase Details
Closed on
Feb 13, 2020
Sold by
Turley Jeffrey M and Turley Susan S
Bought by
Degnan Peter T and Degamn Sarah E
Current Estimated Value
Home Financials for this Owner
Home Financials are based on the most recent Mortgage that was taken out on this home.
Original Mortgage
$436,050
Outstanding Balance
$385,341
Interest Rate
3.72%
Mortgage Type
New Conventional
Estimated Equity
$368,594
Purchase Details
Closed on
Jul 2, 2013
Sold by
Mcdermott Rt and Mcdermott
Bought by
Turley Jeffrey M and Turley Susan
Home Financials for this Owner
Home Financials are based on the most recent Mortgage that was taken out on this home.
Original Mortgage
$241,656
Interest Rate
2.73%
Mortgage Type
New Conventional
Purchase Details
Closed on
Mar 29, 2004
Sold by
Mcdermott James F and Mcdermott Carol F
Bought by
Mcdermott Rt and Mcdermott
Create a Home Valuation Report for This Property
The Home Valuation Report is an in-depth analysis detailing your home's value as well as a comparison with similar homes in the area
Home Values in the Area
Average Home Value in this Area
Purchase History
| Date | Buyer | Sale Price | Title Company |
|---|---|---|---|
| Degnan Peter T | $459,000 | None Available | |
| Turley Jeffrey M | $300,000 | -- | |
| Turley Jeffrey M | $300,000 | -- | |
| Mcdermott Rt | -- | -- | |
| Mcdermott Rt | -- | -- |
Source: Public Records
Mortgage History
| Date | Status | Borrower | Loan Amount |
|---|---|---|---|
| Open | Degnan Peter T | $436,050 | |
| Previous Owner | Turley Jeffrey M | $241,656 |
Source: Public Records
Tax History Compared to Growth
Tax History
| Year | Tax Paid | Tax Assessment Tax Assessment Total Assessment is a certain percentage of the fair market value that is determined by local assessors to be the total taxable value of land and additions on the property. | Land | Improvement |
|---|---|---|---|---|
| 2025 | $6,050 | $611,100 | $318,100 | $293,000 |
| 2024 | $5,827 | $560,800 | $298,200 | $262,600 |
| 2023 | $5,634 | $497,700 | $268,400 | $229,300 |
| 2022 | $5,478 | $423,000 | $228,600 | $194,400 |
| 2021 | $5,165 | $391,600 | $218,700 | $172,900 |
| 2020 | $4,374 | $328,100 | $188,900 | $139,200 |
| 2019 | $4,262 | $318,500 | $188,900 | $129,600 |
| 2018 | $4,167 | $311,700 | $188,900 | $122,800 |
| 2017 | $3,902 | $284,400 | $178,900 | $105,500 |
| 2016 | $3,721 | $268,100 | $169,000 | $99,100 |
| 2015 | $3,563 | $268,100 | $169,000 | $99,100 |
| 2014 | $3,493 | $262,800 | $169,000 | $93,800 |
Source: Public Records
Map
Nearby Homes