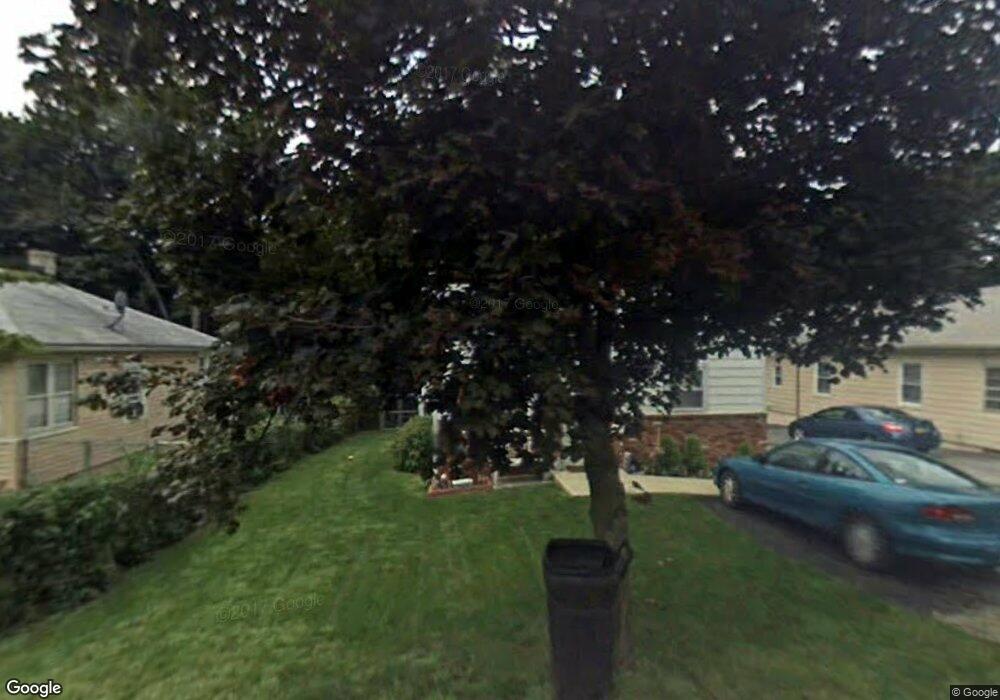
29 Fowler St Franklin, NJ 07416
Estimated Value: $303,885 - $406,000
--
Bed
--
Bath
1,044
Sq Ft
$335/Sq Ft
Est. Value
About This Home
This home is located at 29 Fowler St, Franklin, NJ 07416 and is currently estimated at $349,721, approximately $334 per square foot. 29 Fowler St is a home located in Sussex County with nearby schools including Franklin Elementary School, Wallkill Valley Regional High School, and Immaculate Conception Regional School.
Ownership History
Date
Name
Owned For
Owner Type
Purchase Details
Closed on
Apr 10, 2012
Sold by
Whitney Thomas
Bought by
Gaffney Suzanne
Current Estimated Value
Purchase Details
Closed on
Mar 30, 2005
Sold by
Gunther Mark S and Gunther Mary Lou
Bought by
Gaffney Suzanne and Whitney Thomas
Home Financials for this Owner
Home Financials are based on the most recent Mortgage that was taken out on this home.
Original Mortgage
$201,880
Interest Rate
5.78%
Mortgage Type
Fannie Mae Freddie Mac
Purchase Details
Closed on
Aug 18, 2003
Sold by
Estate Of Rosario A Merenda and Ziluk Peter S
Bought by
Gunther Mark S and Gunther Mary Lou
Home Financials for this Owner
Home Financials are based on the most recent Mortgage that was taken out on this home.
Original Mortgage
$104,000
Interest Rate
6.02%
Mortgage Type
Purchase Money Mortgage
Create a Home Valuation Report for This Property
The Home Valuation Report is an in-depth analysis detailing your home's value as well as a comparison with similar homes in the area
Home Values in the Area
Average Home Value in this Area
Purchase History
| Date | Buyer | Sale Price | Title Company |
|---|---|---|---|
| Gaffney Suzanne | -- | None Available | |
| Gaffney Suzanne | $252,350 | Chicago Title Insurance Co | |
| Gunther Mark S | $130,000 | Fidelity Natl Title Ins Co N |
Source: Public Records
Mortgage History
| Date | Status | Borrower | Loan Amount |
|---|---|---|---|
| Previous Owner | Gaffney Suzanne | $201,880 | |
| Previous Owner | Gunther Mark S | $104,000 |
Source: Public Records
Tax History Compared to Growth
Tax History
| Year | Tax Paid | Tax Assessment Tax Assessment Total Assessment is a certain percentage of the fair market value that is determined by local assessors to be the total taxable value of land and additions on the property. | Land | Improvement |
|---|---|---|---|---|
| 2025 | $4,737 | $204,100 | $89,100 | $115,000 |
| 2024 | $4,679 | $178,500 | $67,900 | $110,600 |
| 2023 | $4,679 | $169,700 | $62,300 | $107,400 |
| 2022 | $6,157 | $145,700 | $56,100 | $89,600 |
| 2021 | $5,980 | $145,700 | $56,100 | $89,600 |
| 2020 | $5,792 | $145,700 | $56,100 | $89,600 |
| 2019 | $5,529 | $145,700 | $56,100 | $89,600 |
| 2018 | $5,436 | $145,700 | $56,100 | $89,600 |
| 2017 | $5,303 | $145,700 | $56,100 | $89,600 |
| 2016 | $5,188 | $145,700 | $56,100 | $89,600 |
| 2015 | $5,204 | $145,700 | $56,100 | $89,600 |
| 2014 | $5,072 | $145,700 | $56,100 | $89,600 |
Source: Public Records
Map
Nearby Homes
- 26 Wyker Rd Unit A
- 26 Wyker Rd Unit 2207
- 65 Buckwheat Rd
- 112 Scott Rd
- 52 High St
- 70 Davis Rd
- 116 Scott Rd
- 2 Cummins St
- 66 Nestor St
- 70 Nestor St
- 7 Woodland Rd
- 26 Constitution Way Unit D5
- 28 John Wilton St
- 25 Mabie St
- 1 Ed Mitchell Ave
- 6 South St
- 45 Liberty Ln Unit Y7
- 48 Woodland Rd
- 441 Rutherford Ave
- 14 Sabine Ln