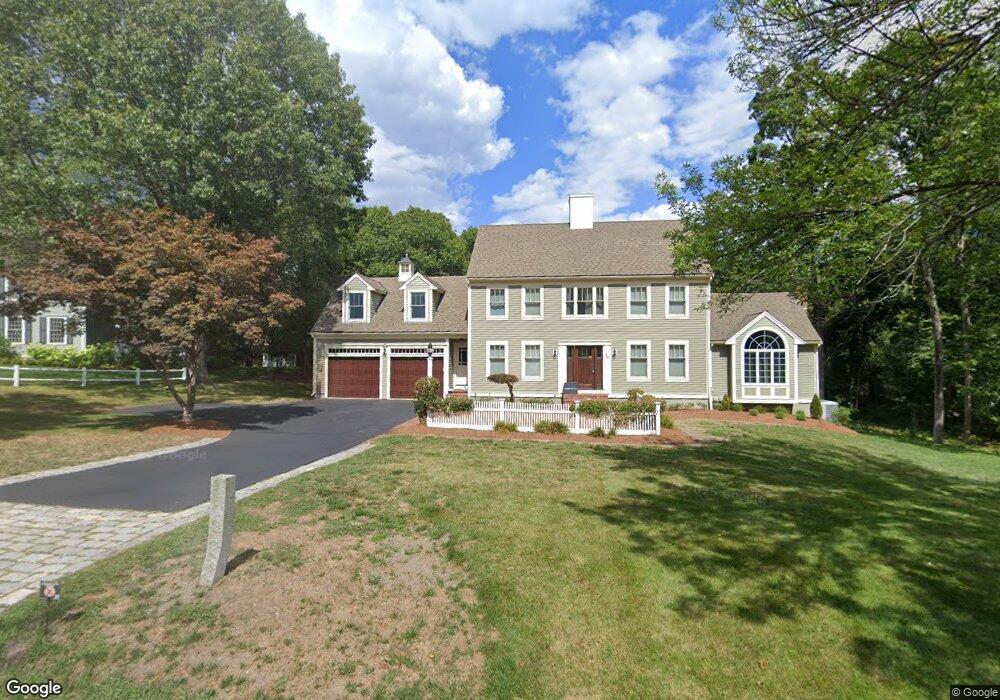
29 Franklin Rodgers Rd Hingham, MA 02043
Estimated Value: $1,544,000 - $2,283,000
4
Beds
3
Baths
2,742
Sq Ft
$723/Sq Ft
Est. Value
About This Home
This home is located at 29 Franklin Rodgers Rd, Hingham, MA 02043 and is currently estimated at $1,981,276, approximately $722 per square foot. 29 Franklin Rodgers Rd is a home located in Plymouth County with nearby schools including Plymouth River Elementary School, Hingham Middle School, and Hingham High School.
Ownership History
Date
Name
Owned For
Owner Type
Purchase Details
Closed on
Nov 15, 2005
Sold by
Sullivan Shawn T and Sullivan Elaine M
Bought by
Novak Joshua A and Novak Krista
Current Estimated Value
Home Financials for this Owner
Home Financials are based on the most recent Mortgage that was taken out on this home.
Original Mortgage
$811,500
Interest Rate
5.93%
Mortgage Type
Purchase Money Mortgage
Purchase Details
Closed on
Jan 10, 2003
Sold by
Kondratova Irina Petrova and Kondratova Irina P
Bought by
Sullivan Shawn T and Sullivan Elaine M
Purchase Details
Closed on
Aug 24, 1999
Sold by
Mcwade Paul and Mcwade Constance M
Bought by
Kondratova Irina P
Purchase Details
Closed on
Apr 16, 1996
Sold by
Scott Jeffrey R and Scott Kathleen M
Bought by
Mcwade Paul A and Mcwade Constance M
Purchase Details
Closed on
Jan 4, 1994
Sold by
Quality Homes Rt and Reardon John J
Bought by
Scott Jeffrey R and Scott Kathleen M
Create a Home Valuation Report for This Property
The Home Valuation Report is an in-depth analysis detailing your home's value as well as a comparison with similar homes in the area
Purchase History
| Date | Buyer | Sale Price | Title Company |
|---|---|---|---|
| Novak Joshua A | $1,082,000 | -- | |
| Sullivan Shawn T | $820,000 | -- | |
| Kondratova Irina P | $625,000 | -- | |
| Mcwade Paul A | $400,000 | -- | |
| Scott Jeffrey R | $284,300 | -- | |
| Scott Jeffrey R | $284,300 | -- |
Source: Public Records
Mortgage History
| Date | Status | Borrower | Loan Amount |
|---|---|---|---|
| Open | Scott Jeffrey R | $700,000 | |
| Closed | Scott Jeffrey R | $811,500 |
Source: Public Records
Tax History
| Year | Tax Paid | Tax Assessment Tax Assessment Total Assessment is a certain percentage of the fair market value that is determined by local assessors to be the total taxable value of land and additions on the property. | Land | Improvement |
|---|---|---|---|---|
| 2025 | $18,562 | $1,736,400 | $638,400 | $1,098,000 |
| 2024 | $17,830 | $1,643,300 | $638,400 | $1,004,900 |
| 2023 | $15,553 | $1,555,300 | $638,400 | $916,900 |
| 2022 | $15,229 | $1,317,400 | $576,200 | $741,200 |
| 2021 | $14,638 | $1,240,500 | $554,000 | $686,500 |
| 2020 | $14,303 | $1,240,500 | $554,000 | $686,500 |
| 2019 | $14,157 | $1,198,700 | $554,000 | $644,700 |
| 2018 | $14,109 | $1,198,700 | $554,000 | $644,700 |
| 2017 | $14,070 | $1,148,600 | $576,200 | $572,400 |
| 2016 | $14,001 | $1,121,000 | $548,600 | $572,400 |
| 2015 | $12,873 | $1,027,400 | $522,100 | $505,300 |
Source: Public Records
Map
Nearby Homes
- 6 Adams Ct
- 156 Fort Hill St
- 1 Squirrel Hill Ln
- 1206 Tuckers Ln Unit 1206
- 225 South St Unit 1
- 6 Brewer Way
- 43 Park View Dr
- 21 Hersey St
- 7 Lewis Ct
- 19 Lantern Ln
- 2 Langlee Rd
- 92 Doris Dr
- 109 Merryknoll Rd
- 30 Puritan Rd
- 151 Stayner Dr Unit 151
- 425 East St
- 132 Hms Stayner Dr Unit 132
- 23 Shipyard Dr Unit 206
- 5 Endicott St
- 70 Holmes Ave
- 31 Franklin Rodgers Rd
- 24 Franklin Rodgers Rd
- 33 Franklin Rodgers Rd
- 28 Franklin Rodgers Rd
- 22 Franklin Rodgers Rd
- 30 Franklin Rodgers Rd
- 35 Franklin Rodgers Rd
- 23 Franklin Rodgers Rd
- 20 Franklin Rodgers Rd
- 32 Franklin Rodgers Rd
- 37 Franklin Rodgers Rd
- 24 Isaac Sprague Dr
- 21 Franklin Rodgers Rd
- 18 Franklin Rodgers Rd
- 27 Isaac Sprague Dr
- 34 Franklin Rodgers Rd
- 22 Isaac Sprague Dr
- 19 Franklin Rodgers Rd
- 16 Franklin Rodgers Rd
- 4 Edgar Walker Ct
Your Personal Tour Guide
Ask me questions while you tour the home.