Estimated Value: $62,000 - $127,000
3
Beds
2
Baths
1,830
Sq Ft
$53/Sq Ft
Est. Value
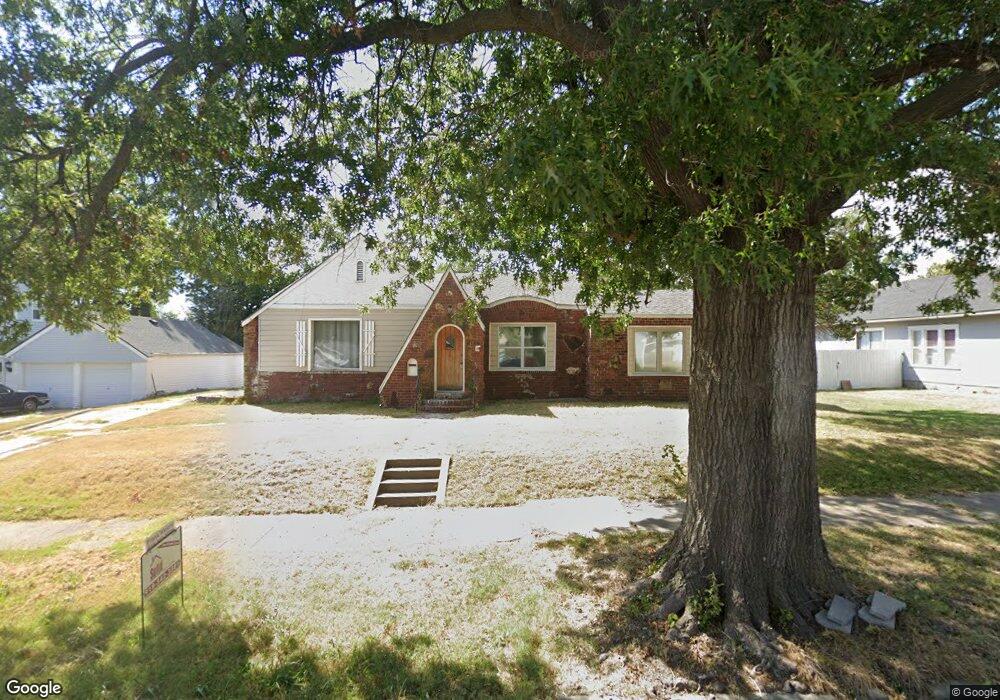
About This Home
This home is located at 29 G St NW, Miami, OK 74354 and is currently estimated at $97,862, approximately $53 per square foot. 29 G St NW is a home located in Ottawa County with nearby schools including Miami High School and Mt. Olive Lutheran School.
Ownership History
Date
Name
Owned For
Owner Type
Purchase Details
Closed on
May 29, 2024
Sold by
Hargrove Joe Curtis and Mcllroy-Hargrove Elaine
Bought by
Hargrove Nicholas
Current Estimated Value
Purchase Details
Closed on
Nov 23, 2022
Sold by
Wade Charles E
Bought by
Hargrove Joe Curtis
Purchase Details
Closed on
Dec 30, 2019
Sold by
Peterson Geneva A
Bought by
Dollison Zachary G and Wade Charles E
Purchase Details
Closed on
Jul 8, 2015
Sold by
Dawson Travis and Dawson Janice
Bought by
Peterson Geneva A and Edson Mary D
Purchase Details
Closed on
Feb 24, 2014
Bought by
Poole Daniel Dee
Create a Home Valuation Report for This Property
The Home Valuation Report is an in-depth analysis detailing your home's value as well as a comparison with similar homes in the area
Home Values in the Area
Average Home Value in this Area
Purchase History
| Date | Buyer | Sale Price | Title Company |
|---|---|---|---|
| Hargrove Nicholas | -- | None Listed On Document | |
| Hargrove Joe Curtis | $50,500 | -- | |
| Dollison Zachary G | $4,000 | None Available | |
| Peterson Geneva A | -- | None Available | |
| Poole Daniel Dee | $19,000 | -- |
Source: Public Records
Tax History Compared to Growth
Tax History
| Year | Tax Paid | Tax Assessment Tax Assessment Total Assessment is a certain percentage of the fair market value that is determined by local assessors to be the total taxable value of land and additions on the property. | Land | Improvement |
|---|---|---|---|---|
| 2025 | $555 | $5,482 | $587 | $4,895 |
| 2024 | $555 | $5,757 | $587 | $5,170 |
| 2023 | $555 | $5,757 | $627 | $5,130 |
| 2022 | $351 | $3,793 | $627 | $3,166 |
| 2021 | $341 | $3,613 | $627 | $2,986 |
| 2020 | $328 | $3,441 | $627 | $2,814 |
| 2019 | $271 | $3,302 | $627 | $2,675 |
| 2018 | $267 | $3,234 | $627 | $2,607 |
| 2017 | $259 | $3,080 | $627 | $2,453 |
| 2016 | $236 | $2,934 | $627 | $2,307 |
| 2015 | $248 | $2,794 | $598 | $2,196 |
| 2014 | $24 | $292 | $292 | $0 |
Source: Public Records
Map
Nearby Homes